Find Precise Reversal Points at Ignored Areas
Technical analysts seem to continue perpetuating a myth that areas where the price spends a lot of time are likely to be important in the future. As someone who trades every single day, on multiple time frames, this doesn’t seem to be the case. In fact, when price comes back to these well tested areas it will often move right through the area.
It turns out that levels which are likely to be important in the future are areas where the price spent little time trading at the last time it passed through. Most traders ignore these levels, thinking they are inconsequential. But assume for a moment the price is rallying, and then very sharply reverses.
Most traders don’t give any thought to that area right near the top which caused the price to reverse, yet since the price didn’t spend very long there, there is likely to still be lots of orders in that area, especially since the price left the area so quickly.
When the price turns very sharply, leaving a lot of traders stranded, that area is likely to be important next time (and only the next time, it does not continue to be important indefinitely) the price comes back to that area.
We still need other forms of analysis, such as trend channels and open space, to determine which of these potentially important levels we want to take trades around. By highlighting those areas on our chart we see potential trade areas well before the price even comes back to the area.
Figure 1 shows two examples of this.
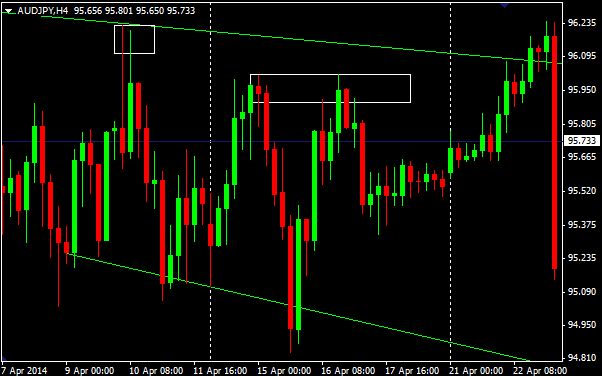
In the first example (left box) we have a red bar that made a new high but then completely collapsed. On the next price bar (green) it rallies back toward the high of the prior bar, but also collapses when it gets close to the former high.
The very sharp reversal off the high of that first bar indicates selling, even though the price didn’t stay there for long. When the price goes back toward that level (on the second bar) it offers another good selling opportunity, and the price does continue lower after that bar.
In the next box the price advance stalls out and reverses sharply. When the price comes back to that small area that caused the prior reversal the level still holds and causes the price to fall once again.
We also see some sharp reversals along the bottom of the chart, yet these aren’t as compelling for trading because they go against the major trend–which is down at this point. The price is making lower lows and lower highs, so we don’t want to take long positions.
Instead we want to focus on short positions, and if you are looking for short positions and the price rallies close a spot where the market quickly reversed before, it could be a very good low risk trade.
Figure 2 shows another example. The overall downtrend continues, but the price rallies right back into a small pocket that was powerful enough to reverse the price last time, and it is still powerful enough to reverse it this time.
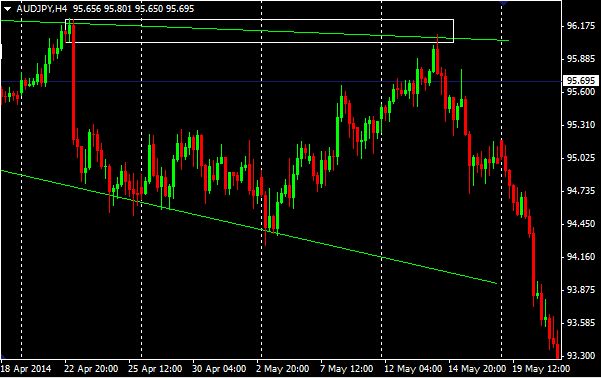
These are 4-hour charts so by highlighting these areas we can pick pretty precise entry points. The method is applicable to all time frames though.
Remember, we still want to trade in the direction of the overall trend. But when the price reaches one of these support or resistance pockets–which caused price to reverse quickly and wasn’t trade at for long–and it aligns with the trend, it is high probability trade.
Once we have used one of these pockets or areas for a trade, don’t use it again for some time, because after it has been traded at a couple times there is likely to be less orders there and it will lose its significance.