Fed Rate Hike Expectations Drop. The Euro Takes Advantage
EUR/USD Bounces at Long-Term S/R Level. Is Parity Next?
U.S. inflation continues to be the centerpiece that spurs the strongest USD movement and last week this proved true once again. The year-over-year CPI reading dropped from the previous 9.1% to 8.5% and the Core version showed 5.9% while the predicted number was 6.1%.
These softer numbers determined market participants to adjust their rate hike expectations to 50 bps for the September Fed meeting, while previously the market was pricing in a 75 bps hike. Some Fed members still see a 75 bps hike as a possibility but still, the CPI numbers weakened the greenback and allowed the Euro to climb to a weekly high of 1.0368 against the Dollar. However, key resistance came into play and the pair is currently trading near 1.0230.
Key Data for the Week Ahead
The first notable event of the week is the release of the German ZEW Economic Sentiment scheduled for Tuesday at 9:00 am GMT. This is a survey of about 300 German professional analysts and investors and it acts as a leading indicator of economic health. The impact is medium and usually, numbers above the forecast strengthen the Euro.
A day later, Wednesday at 9:00 am GMT, the Flash Eurozone GDP comes out but its impact is overshadowed by the Preliminary Flash version that came out 20 days earlier. Still, numbers above the anticipated 0.7% can be beneficial for the single currency.
Probably the most important release of the week will be the U.S. Retail Sales and Core Retail Sales numbers that are scheduled to come out Wednesday at 12:30 pm GMT. The expected change for the former indicator is 0.2% (previous 1.0%) and 0.1% (previous 1.0%) for the latter.
Later the same day the FOMC Minutes come out, offering insights into the FOMC’s latest meeting and possibly offering hints about the size of the next rate hike. The release is scheduled for 6:00 pm GMT.
Technical Outlook – EUR/USD
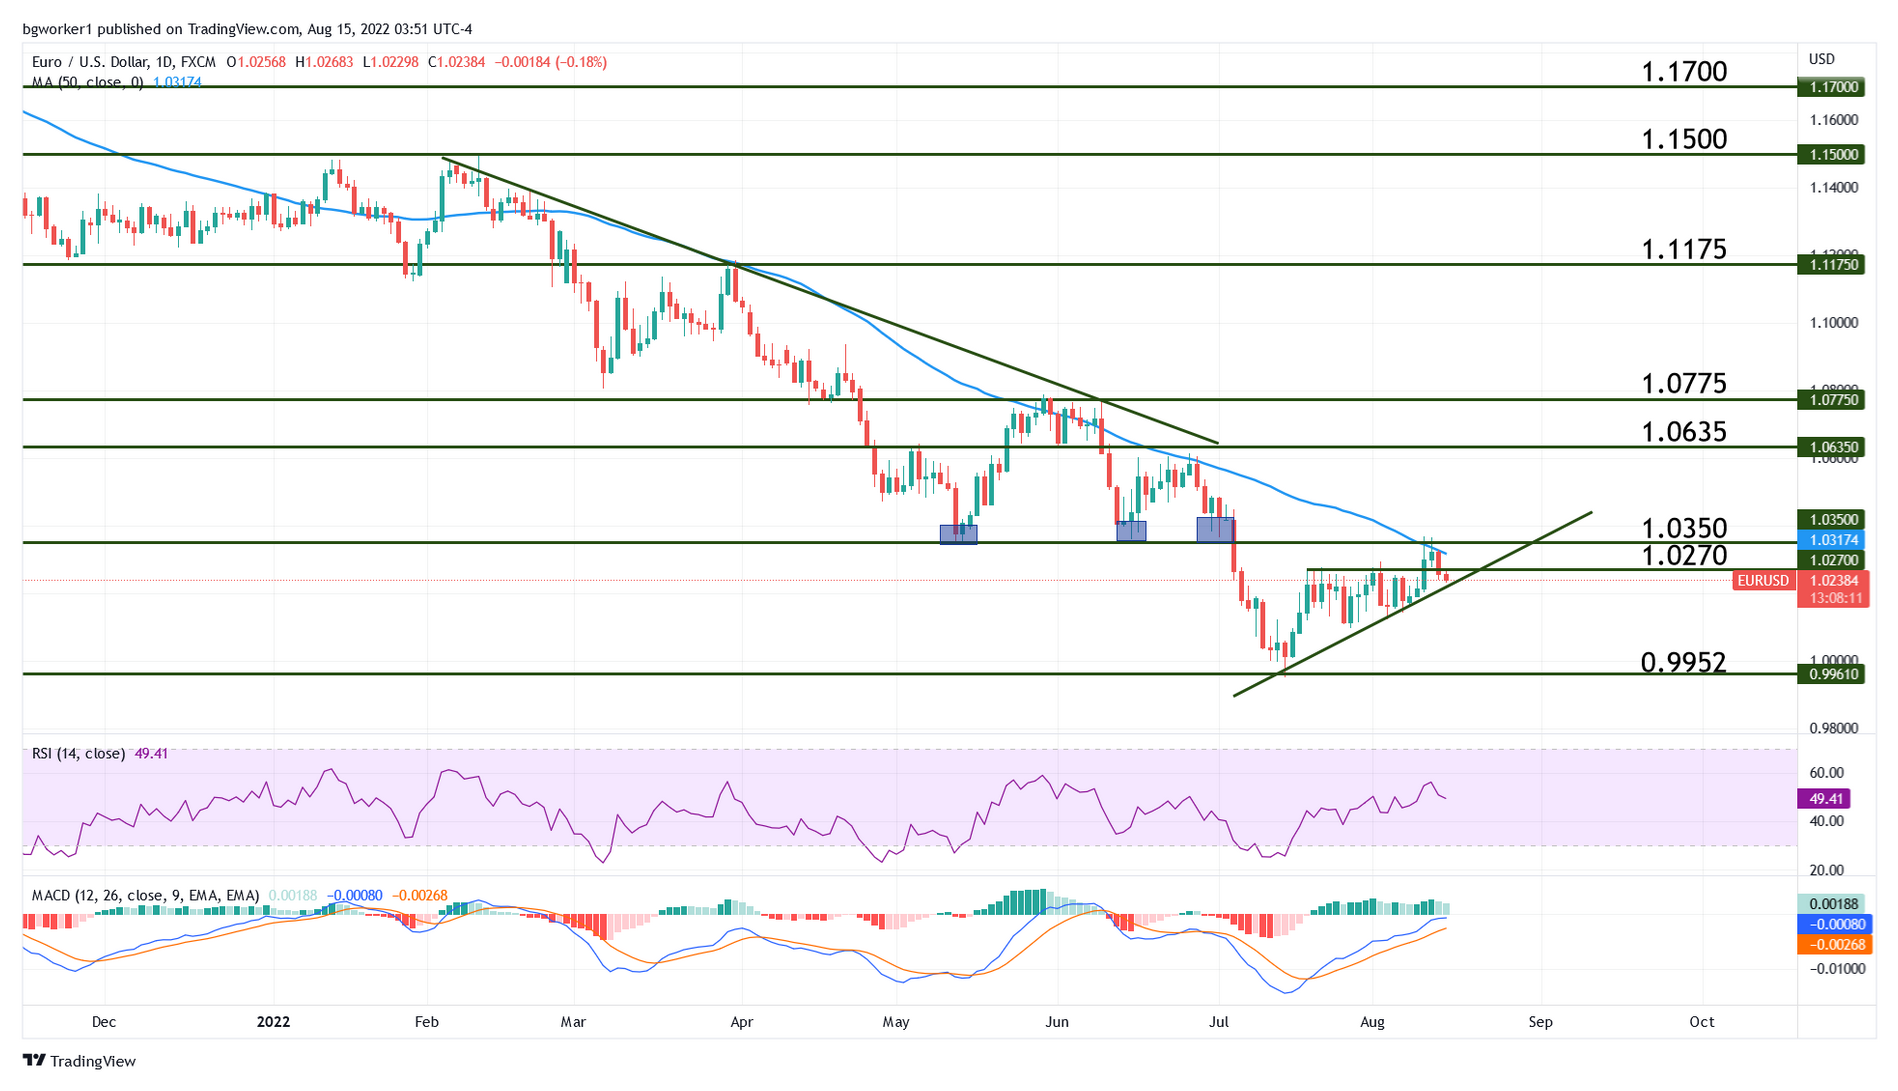
Earlier in the year, the S/R level at 1.0350 pushed falling prices higher three times before being broken to the downside. Support levels oftentimes turn into resistance and it seems this is the case right now as we can see a rejection at 1.0350.
The 50-day Moving Average is very close to the mentioned level, which creates a confluence zone and a high probability of a bounce lower. The medium-term bullish trend line seen on the chart below is a good indicator of what the pair is preparing to do next. A break will set the stage for an extended move south and possibly a resumption of the downtrend, while a bounce will increase the chances of a break of 1.0350 resistance.