Evolution Of A Trade
As I was watching the market last week a trade developed that I think is a text book example of how to use stochastic. I tend to stick to the daily charts and trade on swings but from time to time I drop down to a shorter time frame to check up on day to day action. It was during one of those times this trade revealed itself to me. I knew it for what it was at first glance, took a moment or two to switch back and forth from the daily to the 30 minute chart to make sure and then sat back and waited for the entry to arrive. The beauty of this trade is that it is text book, or near text book I should say and you’ll find out why later.
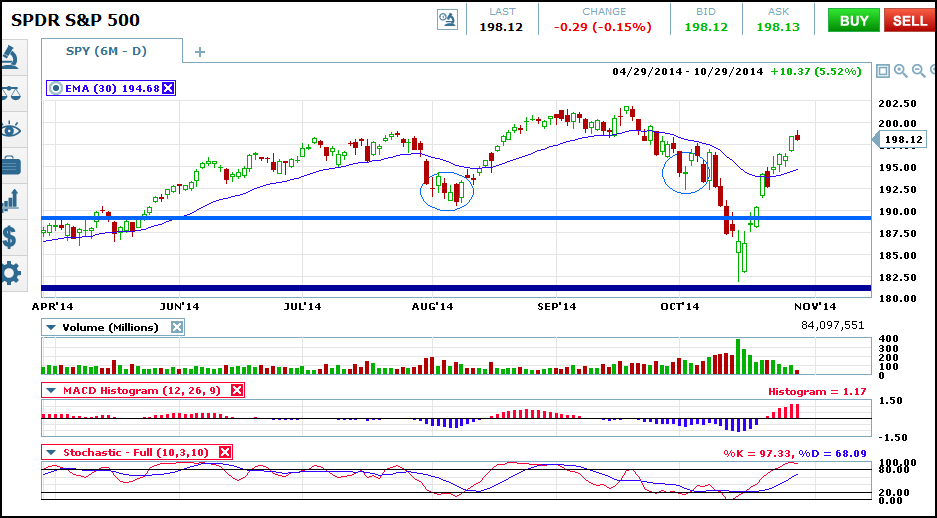
I set up my charts with stochastic and MACD set to standard parameters. That is 10,3,10 for stochastic and 12,26,9 for MACD. I also use an exponential moving average set to 30 bars. This is perfect for catching short term movements on the daily charts and corresponds to a 150 day EMA when I dial out to a weekly chart. Look at the chart below. This is a chart of daily candlesticks of the S&P 500.The recent correction is easy to see as well as the bounce at support. I was pondering the bounce and how strong it is when I realized I was staring profits in the face. I have been expecting a retest of support but was having a hard time deciding when or even if it was going to come. My decision; it will likely come but it didn’t matter because the index was moving up with bullish indicators and therefore any trades should have been bullish. The thing is, there are some reasons present on this chart that gave me pause, namely the strength of the correction and the fact that the index is only a few points away from a strong technical resistance level.
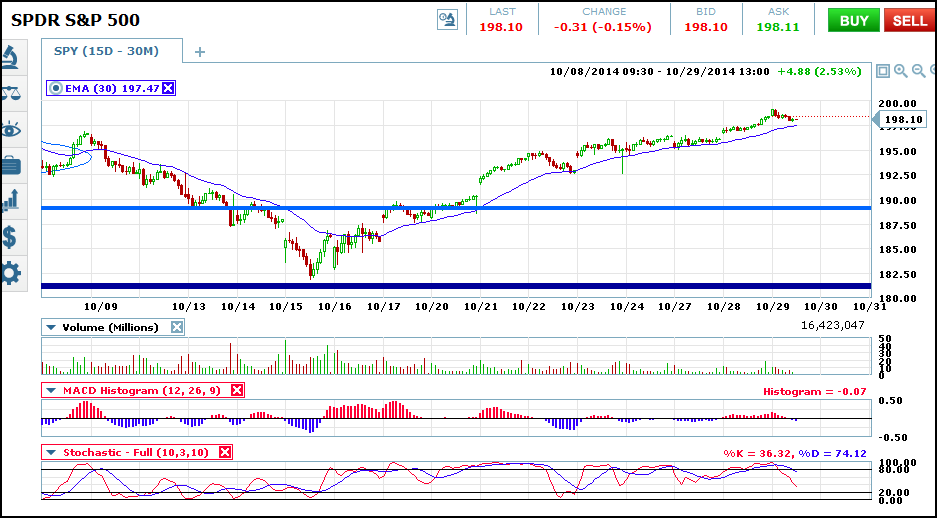
It was for those reasons I decided to move down to the 30 minute charts, to check in on resistance levels and to see how the market was moving on a smaller scale. This next chart is one hour candles and shows the index trading down from a weak level of near term resistance. It also shows the index in a fairly strong uptrend, above the moving average with indicators lining up for a trend following entry. I immediately recognize the set up but was still not quite convinced. There was still a chance for the market to move lower and it was likely any trend following entry would occur at or below the moving average. So I decided to wait.
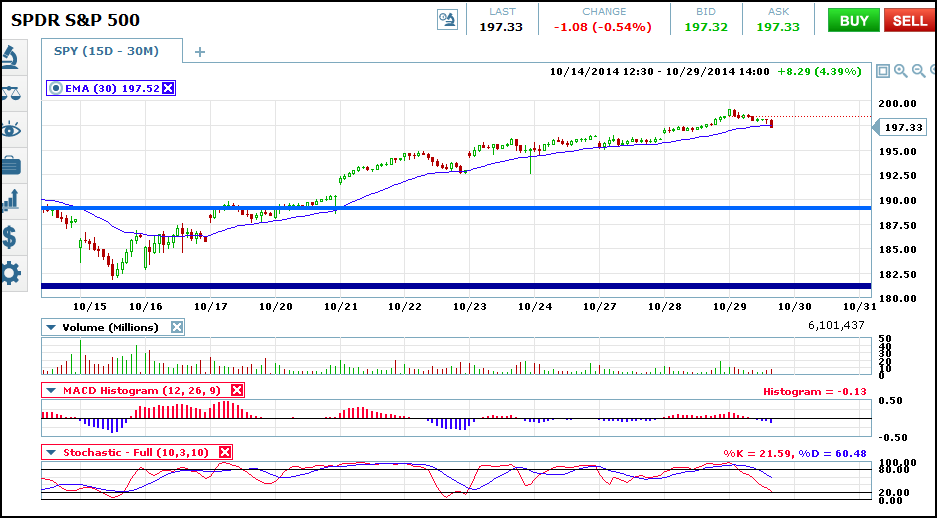
This next chart shows the index did indeed move back to test support along the moving average. At the same time the indicators continued to move lower. The thing to note though is that bearish momentum was very weak and stochastic is indicating a market that is neither hot nor cold but a little oversold in the nearest term. At face value this may look like a bearish set up but don’t forget that this is only a chart of 30 minute prices, the longer term daily charts is still bullish with at least a little room to move higher. It was at this time that I decided to act; I bought a call. This may have been a little hasty as the trend following signal has not appeared yet but I have had a lot of success trading the near term bearish extreme in a longer term bull market and that is what I was banking on here. Because of the risk I chose to make a trade only half the size of my typical trade with an expiration of 24 hours. My results were way better than anticipated.
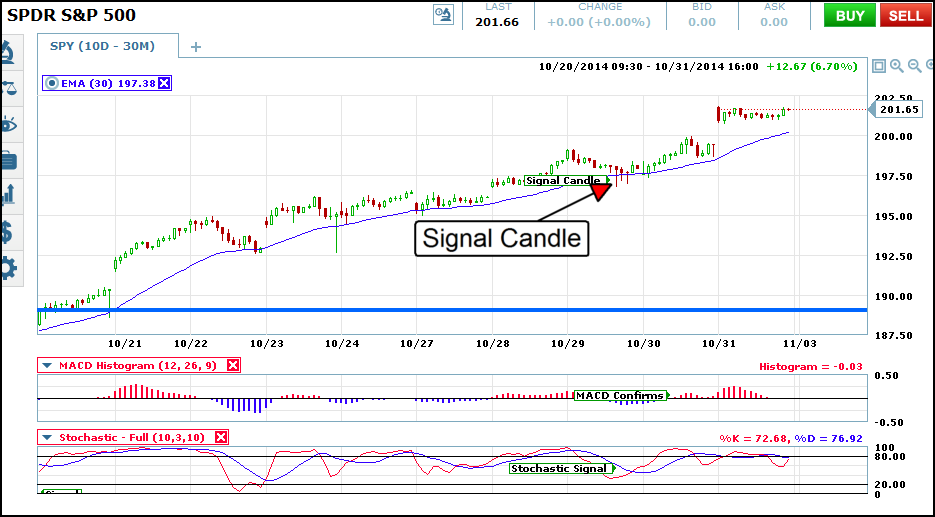
This next chart shows how the trade unfolded. I was fortunate with my early entry which turned out to be the best entry of the move. I marked this the “signal candle”. There were an additional four chances to get in at a similar strike level until the early stochastic signal fires. At that time I double up and entered another 24 hour call with the same investment amount. The following day the market continued to move in my direction and confirmed the early signals with a MACD crossover. I bought another call with a 24 hour expiry. From that point on the market moved higher and higher, offering numerous chances for reentry.