Ethereum Consolidates at Historical Levels
Crypto Dominance: XRP Regains $1
As Bitcoin stabilizes above $57,500, the altcoins are gaining traction and showing positive signs. The front runners are Ripple’s XRP, Ethereum, and one of the best performers of the year: Binance Coin (BNB).
Ripple’s XRP is making an explosive comeback after suffering the heavy blow from the SEC trial. The previous high around $0.64 was shattered Monday and XRP extended gains throughout the week, currently trading at $1.02, which adds up to a whopping 75% increase over the last 7 days.
Ethereum broke above its previous all-time high ($2,036 – TradingView charts), trading back and forth since April 2nd, and peaking at $2,151. For now, ETH is trading at $2,080, still above its previous ATH but it looks like the bulls are taking a breather and that the pair may enter a consolidation phase.
BNB is the year’s MVP thus far, considering that on January 1st it was trading at $39, and at the time of writing, it changes hands for 418 US Dollars. Binance’s digital currency has been a constant climber since the end of March, which means that it may show corrective movement in the near future, as the RSI is already overbought and showing bearish divergence.
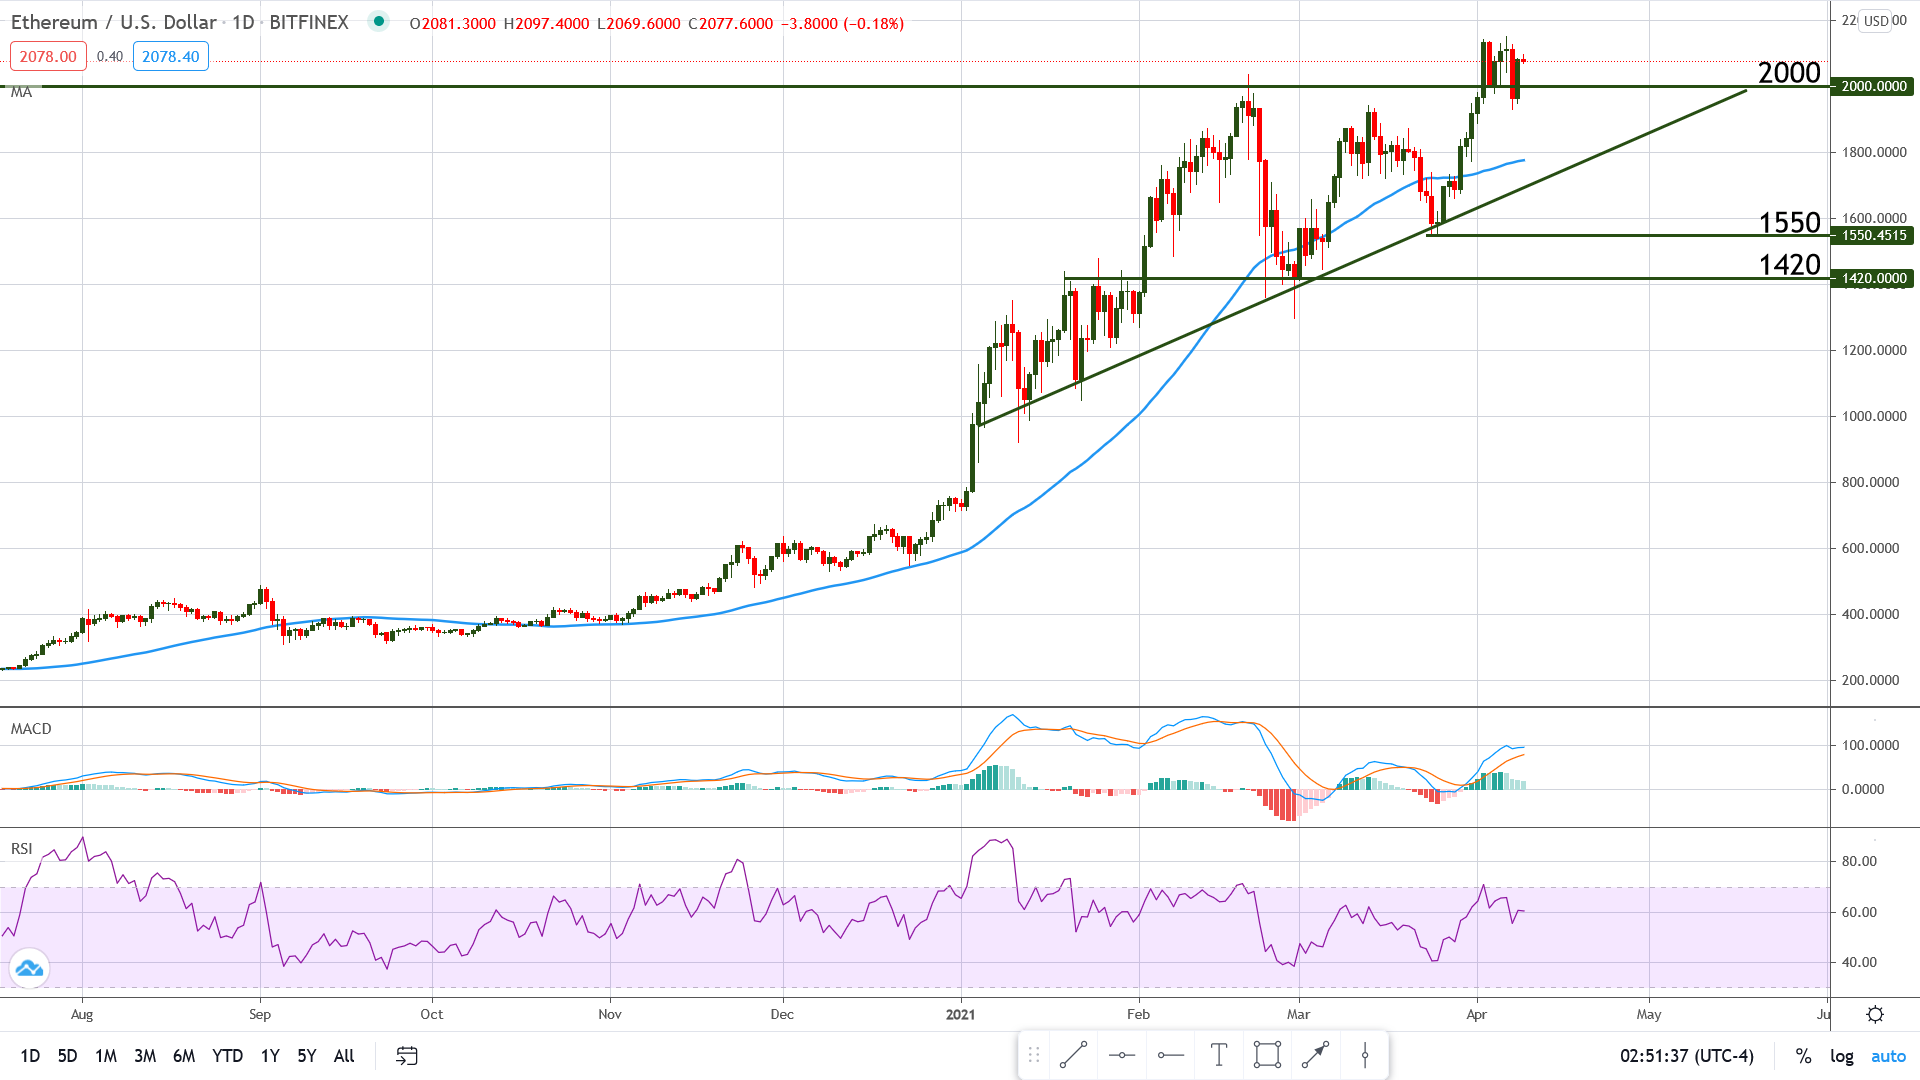
Chart Analysis – ETH/USD
After reaching the previous all-time high at $2,036 on 20 February 2021, Ethereum dropped and reached a low of $1,296 according to TradingView charts. However, it found support around $1,400 – $1,420 and managed to erase most of the losses but failed to print a new high and paused just above $1,900.
A correction after a new high is very normal in an uptrend but the dip was stronger than expected and furthermore, the fact that price stopped just shy of the $2,036 high was a sign that upside momentum was fading.
The new and most recent all-time high at $2,151 re-establishes the control of the bulls and opens the door for new gains but it is also important to note that the pair is consolidating around the $2,000 level, which is technical support, as well as a psychological one (big round number). Green candles are followed by red ones and vice-versa, which means that although an uptrend is in place, the market is still deciding the next direction (also note the Doji candle at the top, which indicates indecision).
If the $2,000 area of support is broken, price may be headed towards the 50 periods Moving Average but as long as the pair remains above the trend line seen on the Daily chart, the main bias will stay bullish