Dollar Rally Stalls Because Trade Concerns Mount, What You Need To Know
The Dollar Index May Have Peaked
The dollar rally has stalled as trade concerns mount. The escalation of rhetoric between the U.S. and China, the threat of tariffs against Mexico, and the uncertainty over the USMCA threaten to disrupt the global trade order. While the U.S. economy remains the strongest worldwide and outlook for growth remains positive, outlook is waning and that is sapping strength in all (most) currencies.
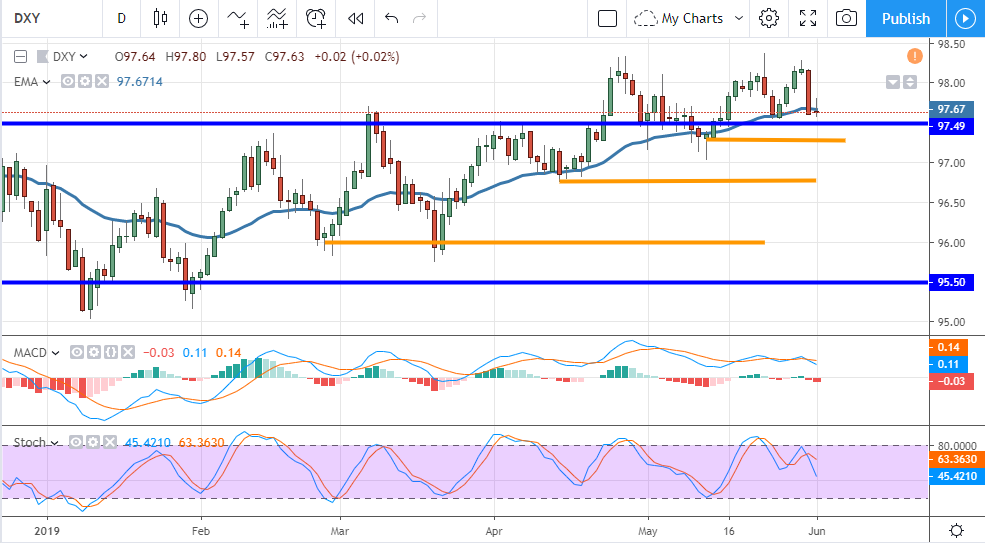
The Dollar Index tried to extend its rally last week but hit resistance and fell back to support. Resistance is near $98.25 and has been tested and confirmed three times. The fall to support halted at $97.50 and the short-term moving average, a level that has been resistance in the past. The indicators are weakening and suggest prices will drift lower if not correct despite the general upward trend over the past two months. A move below $97.50 would be telling and likely lead the index lower within the trading range.
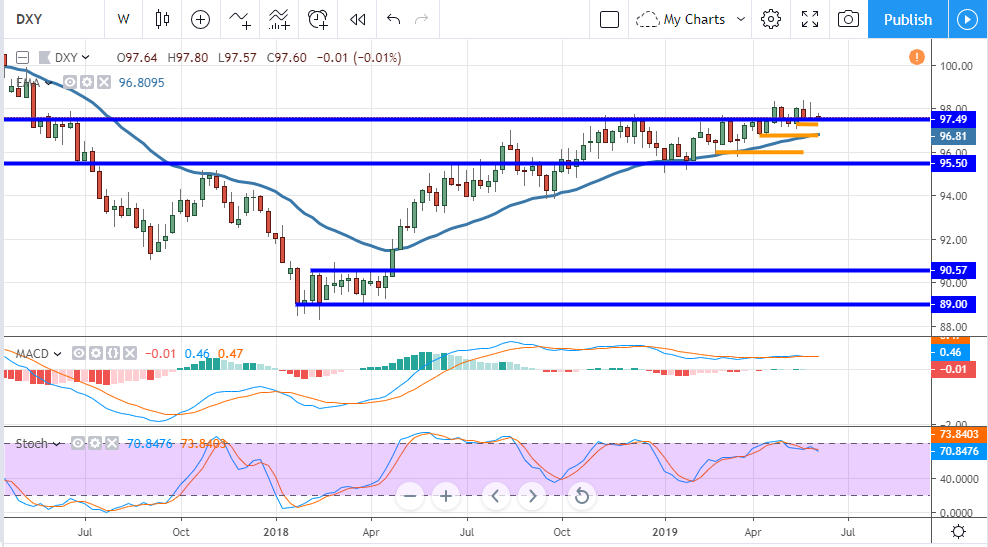
The weekly charts do not look bullish. If anything, the weekly chart of the DXY shows an index that is extended, weak, at a peak, and ready to fall. The price action has been topping out at the $97.50/$98.00 level and that is a long-term high and important technical level. The indicators have wound down to near zero in terms of momentum and direction, they suggest a market that could go either way and fast but with a downward bias. A strong confirmation of resistance at this level, we haven’t seen one yet, could lead this thing down to $95.50 and then $90.50.
The risk is that, while the outlook is bearish, the most extreme portions of the forecast are highly unlikely to be met. For the Dollar Index to trace out a full reversal and move lower other currencies, the euro pound yen, will have to strengthen and the outlook for each of them is shaky at best. The yen at least has the appeal of safe-haven stability, the euro and pound are both shackled by weak economic and unstable domestic political situations that will drag on growth this year.
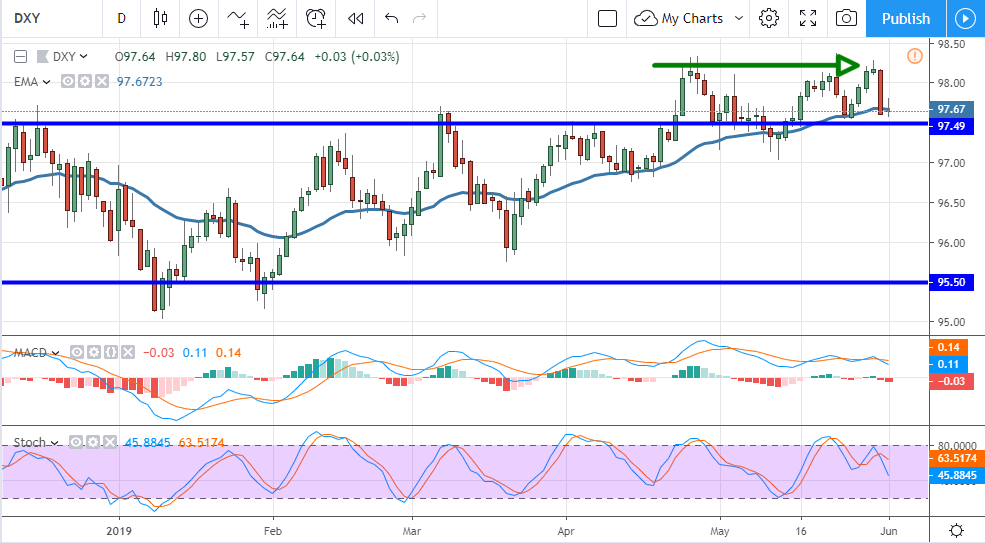
The most likely scenario is range bound trading with $98.25 as the top and $95.50 as a potential bottom. There are other targets for the bottom, higher targets, but until they get tested they are nothing more than theories. These include $96, $96.75, and $97.25 where small troughs formed within the range before. The risk is that support at $97.50 will be strong enough to keep prices from moving back within the previous range and this week’s data may do it.
This is the all-important labor data week which means reports from ADP, Challenger, and the NFP. The reports should show ongoing strength within a healthy labor market with sustained job and wage growth. I expect there will be some evidence of volatility like a high Challenger number but that will likely be offset by things like low unemployment, +3.0% YOY wage growth, and positive revisions to previous NFP figures.