Crypto Lull: A Look at Bitcoin’s Momentum Crisis
BTC/USD at a Standstill. When Will It Erupt?
Bitcoin is trading at almost the same level as it was on August 18th. Apart from two days of high volatility, the Digital Gold has been uncharacteristically flat and totally lacking momentum. But it’s not only Bitcoin that suffers from this laziness. Spot trading for cryptocurrencies in general is crawling at its slowest pace since March 2019, as reported by the digital asset data firm, CCData.
The company offered a glimpse into the current lethargic state of the market. In August, centralized exchange spot trading volume decreased by 7.78%, and derivatives volume dropped by over 12%. This brings spot volume to $475 billion and derivatives volume to $1.62 trillion (marking the second-lowest since 2021).
CCData commented: “The low spot trading volume and the fluctuations in the open interest data suggest that the market is currently driven by speculation”.
Let’s not forget Grayscale’s legal triumph against the SEC last week. Such a victory would otherwise prompt an immediate response from crypto bulls and would typically incite a surge in crypto values.
It seems there’s a lack of interest, or maybe market participants just don’t have a clear bias and they are still waiting to see what the big players do. Fall is here but it remains to be seen if it will be also Bitcoin’s fall.
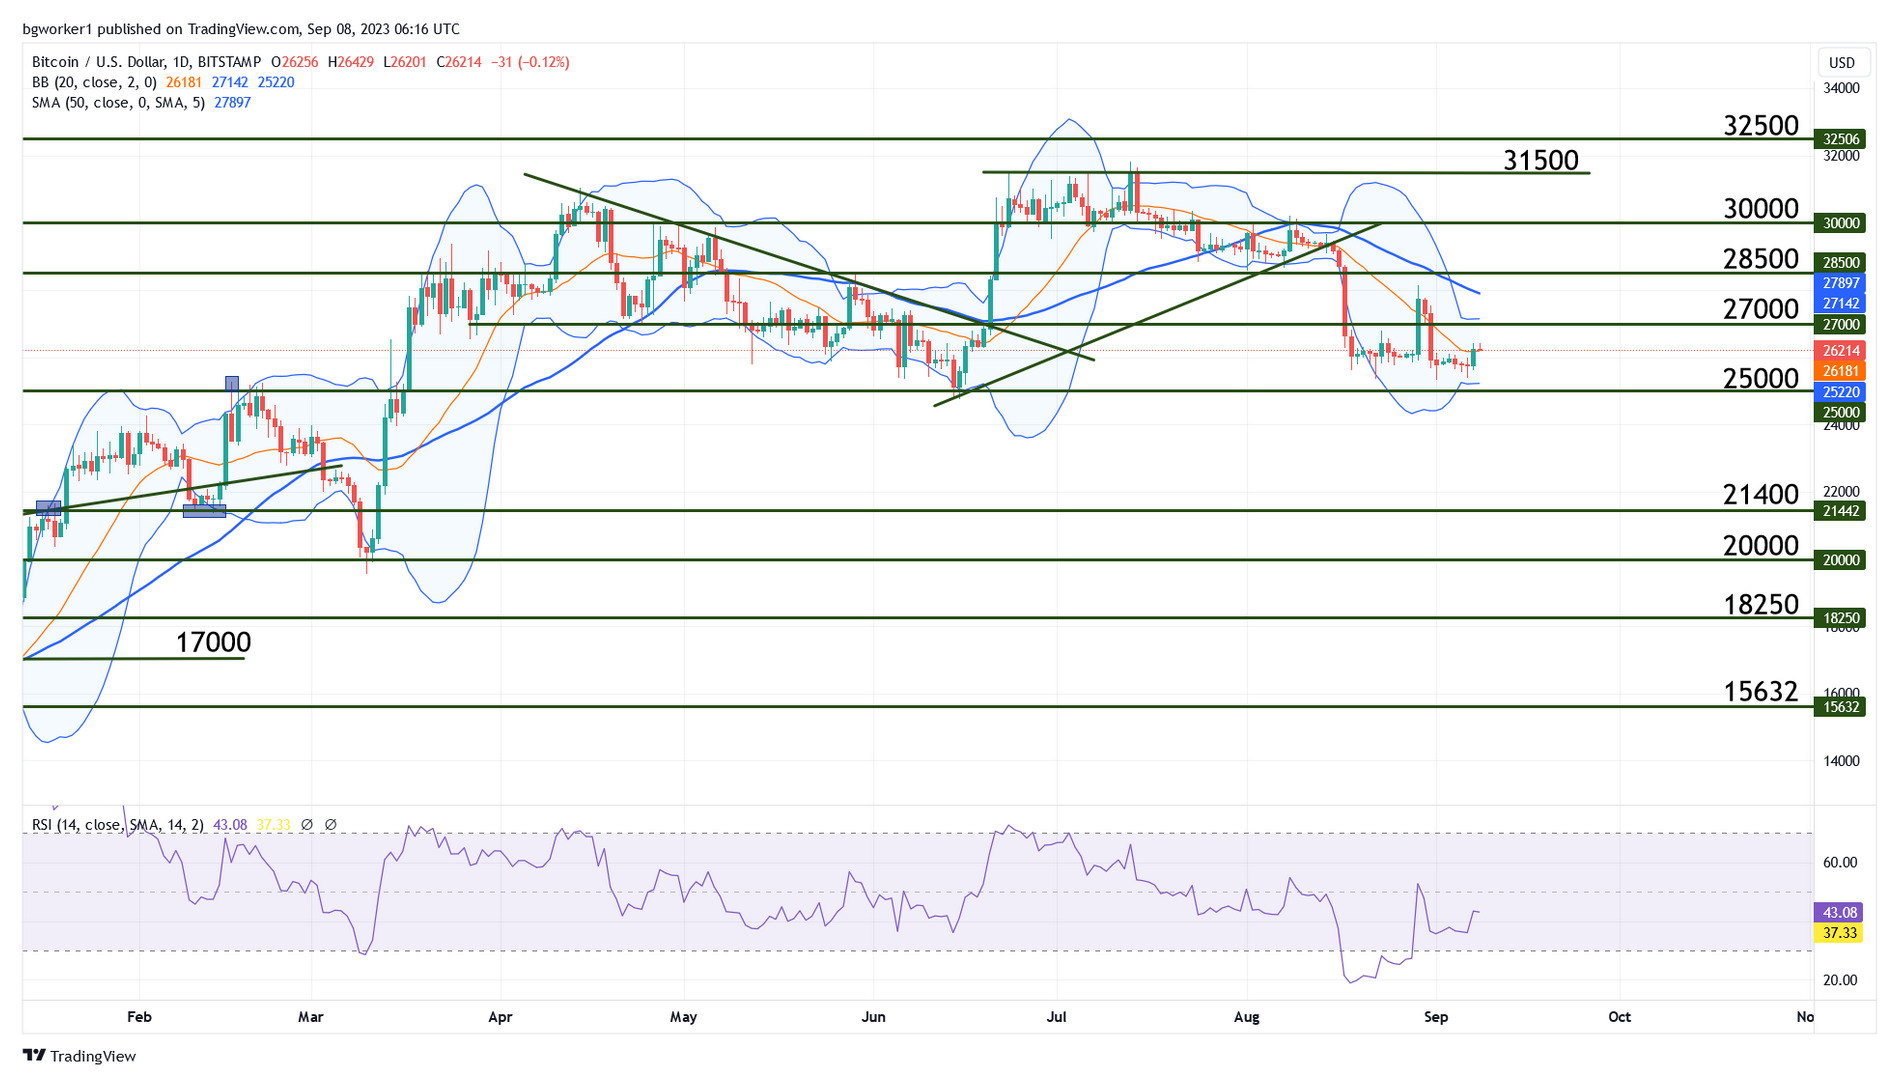
Chart Analysis – BTC/USD
After an impressive performance in June (a surge from $25,000 to $31,500) and a 2023 high in July ($31,818), Bitcoin dropped in August. It triggered a market-wide scare on August 17 when it dropped from $28,700 to 26,260.
Last week has been flat, apart from Thursday when BTC/USD climbed to the middle Bollinger band. This line often acts as support and/or resistance, so if the bulls can surpass it, we may see an extended climb toward the upper Bollinger band. That line coincides with the resistance at $27,000 and the 50-day Moving Average is also close. Given the low volatility and lack of momentum, the probability of a break of this zone is low.
The Relative Strength Index was oversold and now it is showing bullish divergence. The RSI is making higher lows, while the price is making lower lows (albeit very timidly). This may trigger a push into higher territory but we shouldn’t exclude a drop towards $25,000 before the bulls step in and take the pair higher.