Cardano Is The Hot New Cryptocurrency
Green Across the Board – Cardano Is Leading the Charge
by Bogdan Giulvezan
About a week ago, Cardano’s chief developer announced that the Alonzo upgrade, which will bring smart contract functionality, will go live on September 12. The market response was swift and the coin rallied substantially but oftentimes, these massive surges are short-lived and the gains tend to evaporate. This is not the case with Cardano (ADA).
Since the announcement and the initial boost, ADA continued its advance, completed a pullback that established a new and strong support level, and today it just printed a new All-Time High (ATH) at $2.51, breaking the previous ATH at $2.47. We’ve seen times and times again that coins that break their previous ATH tend to shoot to the Moon, thus it’s not farfetched to think that $3.00 is a reachable target.
Since the announcement, Cardano (ADA) climbed to the number 3 spot in CoinMarketCap rankings, with a market cap of $80 billion at press time. The coin recently surpassed Binance Coin (BNB), which has a total market of $72 billion, and Tether (USDT), which currently has a total supply valued at $64 billion. Over the last 7 days, ADA climbed approximately 27.0%, out of which 18.0% was added in the last 24 hours alone.
Adding more fuel to the fire is Cardano’s founder Charles Hoskinson (he is also the co-founder of Ethereum), who recently said in an interview that he expects ADA to climb near $150 by year-end. That is a wild prediction indeed, and one that would mean the coin would gain approximately 60 X from current levels.
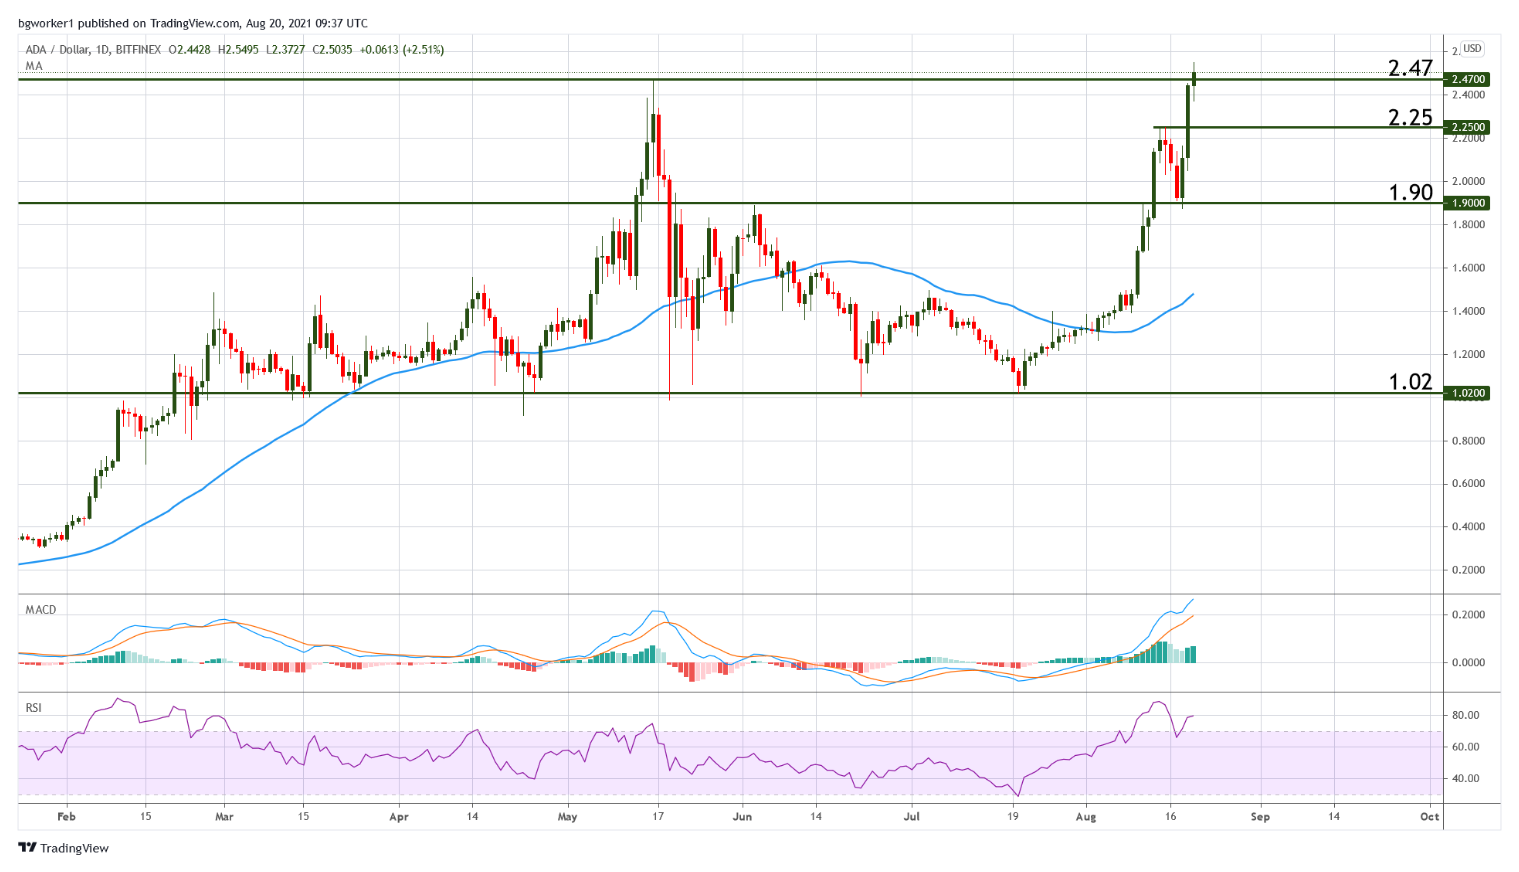
Chart Analysis – ADA/USD
Since mid-July ADA is on fire and in a strong uptrend. Moreover, the pair just broke its All-Time High and if history repeats itself, we are likely to see higher prices. But also according to history, strong moves are followed by pullbacks, thus we may see a counter move until price decides to continue higher.
It’s true that a pullback occurred after the $2.25 peak and this resulted in support being established at $1.90, but the Relative Strength Index is “bursting” out of its range (overbought) and is showing bearish divergence. Price is making a higher high while the oscillator is making a lower high, which is an early sign that a down move may ensue.
Depending on how confident market participants are, we may see an extended move into $2.70 – $2.80, but it’s also possible for the pullback to occur much sooner, around $2.55 – $2.65. When the retracement occurs, price may find support at $2.50 – $2.47, followed by the previous peak at $2.25.