BTC Volatility Rises As Options Expirations Loom
Massive Amounts of Options Contracts Due for Expiration. Watch BTC React!
by Bogdan Giulvezan
At the time of writing, Bitcoin is changing hands at $53,820, which translates into a +1.35% change for the last 24 hours, which is rather “tame” for the crypto-king. However, things may be about to change because almost $6 billion in options contracts are set to expire today, according to data platform Bybt.
Past expiration of options contracts have triggered strong movements in the spot markets, thus it’s likely that today we will see the same pattern. But although in the past, option expiries were shortly followed by bullish movement, we cannot be certain that this will be the case today.
Talking about the mentioned $6 billion options expiry, the co-founders of Glassnode (analytics platform) tweeted that “Bitcoin price expectations for April are high, with lots of investors placing their new bets on $80k.”
Other voices in the industry are expecting a short squeeze based on the fact that Bitcoin managed to defend the $50k barrier, thus putting a lot of sellers out of the money. A quick explanation of short squeeze: it occurs when an asset’s price increases sharply, thus forcing sellers to buy in order to avoid further losses. This action adds more buying pressure, thus making the asset increase in value even more.
On another note, Fed Chair Jerome Powell recently called Bitcoin “essentially a substitute for gold”. He also stated that the digital asset is too volatile to replace fiat currencies but it could have similar utilities to precious metals. Can all of this start a new leg of the uptrend or are we in for more range-bound trading? Let’s take a look at the charts.
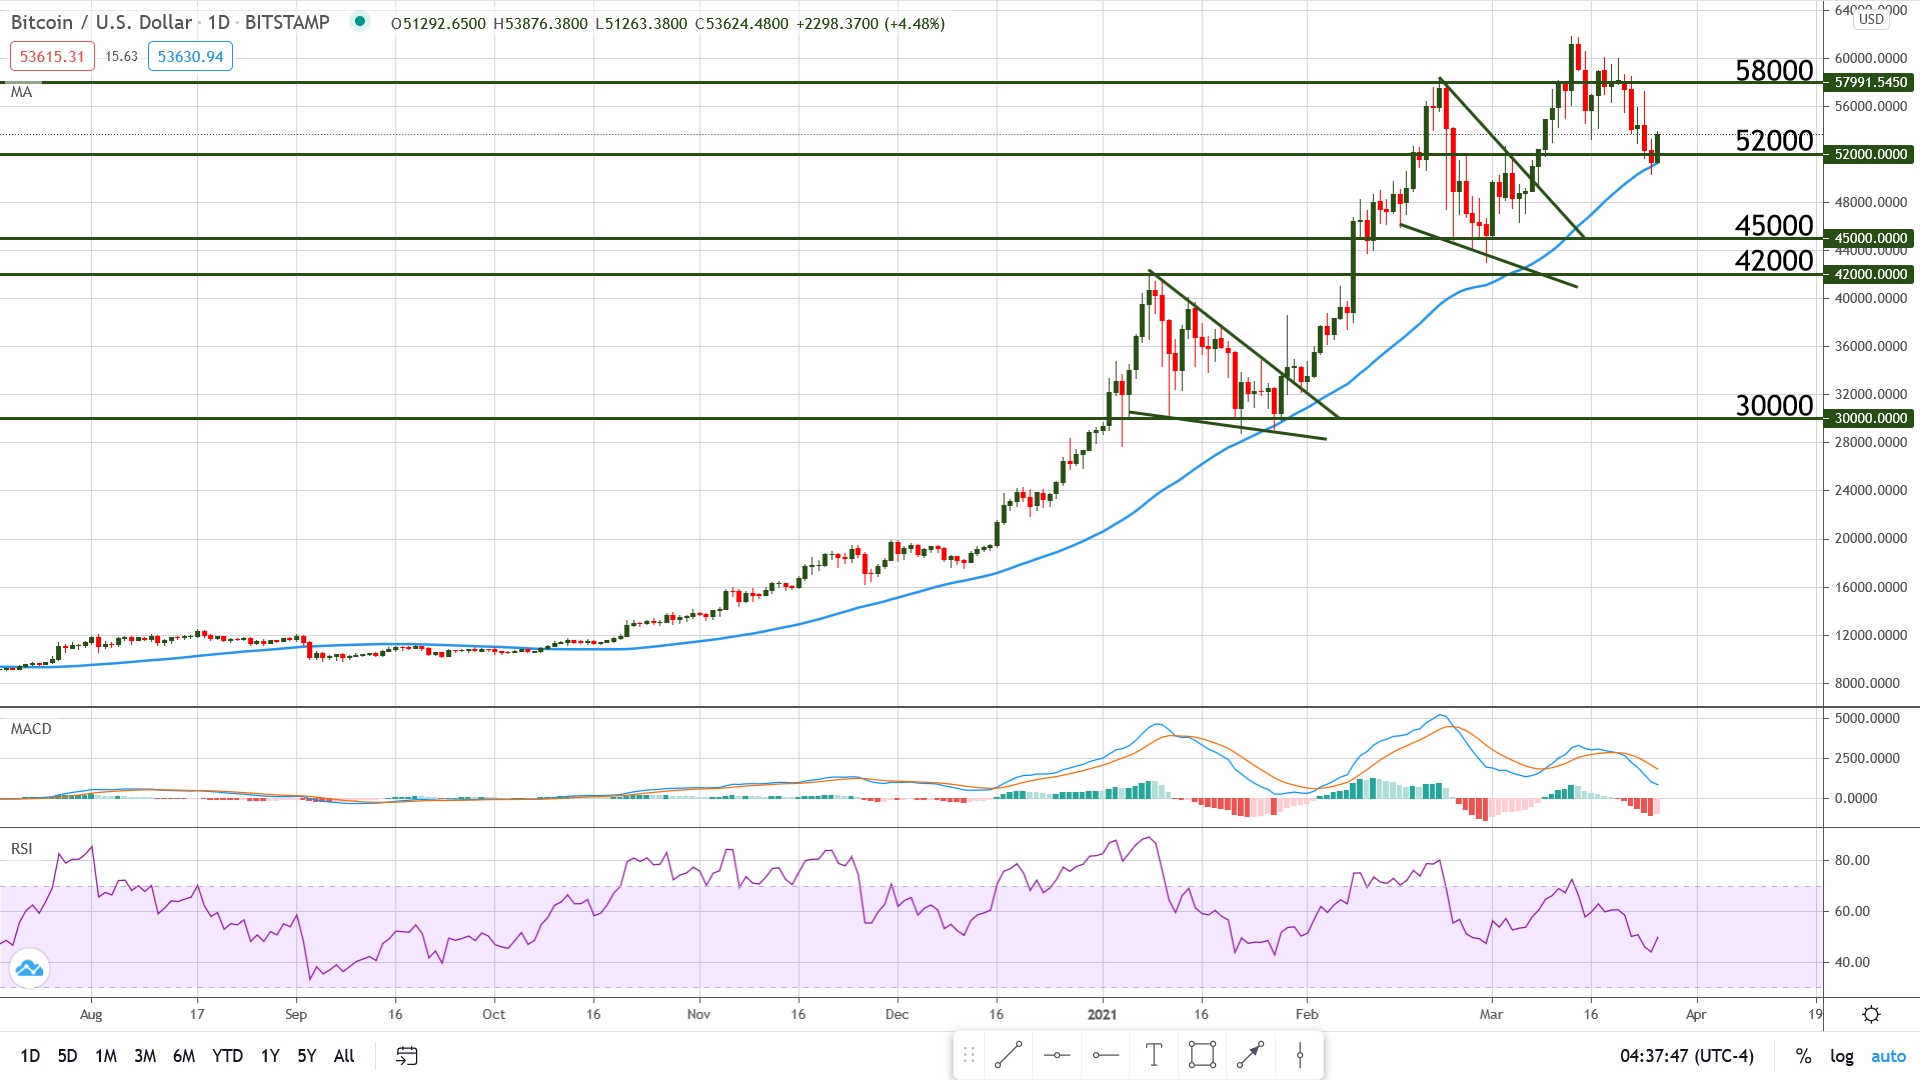
Chart Analysis – BTC/USD
After printing the recent high above $61K, Bitcoin started a correction lower and has been underperforming, with both the MACD and RSI heading south. However, “underperforming” may be too harsh and we must also take into account the fact that the US Dollar has been strengthening against most of its counterparts, thus we are dealing with demand for the quote currency (USD), which drags the pair down.
We can already see price reacting at the $52,000 level, which also coincides with the 50 periods Moving Average (blue line) and together they form a stronger support zone (confluence). A successful bounce at current levels may push BTC above the psychological level at $55,000, which in turn may open the door for another attack on the All-Time High.
It is worth noting that price is making a higher low while the RSI is making a lower low, which is known as hidden bullish divergence and is an indication that another push to the upside will follow. As always, keep in mind that divergence is not a signal to buy or sell on its own and must be used in conjunction with other factors.