BTC Dominates as Whales Resurface and Confidence Rises
$100K in Sight After Clean Breakout. Pullbacks Incoming?
Last month’s main story was the tariff debacle, which had a big impact on the traditional market as well as the crypto market. By the looks of things, the trade war is starting to cool off, with President Trump pausing the tariffs against all countries but China.
Bitcoin had a volatile April, with price swinging wildly, reaching as low as $74,400 and then surpassing $97K. In the not-so-distant past, Bitcoin was regarded as the “digital gold” but more recently, this narrative has started to tone down. The U.S. is facing recession fears, which caused some pundits to believe that crypto will make a comeback as a hedge against economic turmoil and rising inflation. Maybe Digital Gold is back.
On Thursday, Bitcoin broke above the resistance at $95K, which capped it for more than a week. This could be the result of whale accumulation and ETF interest among other things. According to data from CryptoQuant, during the last 4 weeks, whales accumulated roughly $4 billion worth of Bitcoin. Whale accumulation is usually a sign that a strong bullish move will follow and it seems this is the case now, as we are seeing the move developing on the charts.
Probably a significant chunk of the $4 billion was snatched by large companies such as Strategy (previously MicroStrategy) and Metaplanet. These companies are known to be Bitcoin hoarders, buying large quantities regularly.
Bitcoin spot ETFs are also becoming more and more active: BlackRock’s iShares Bitcoin Trust (IBIT) just crossed the legendary landmark of 600K Bitcoin under management. Investor confidence is growing as evidenced by 8 consecutive days of positive inflows. During the run, the ETFs collectively added $3.9 billion to their books. According to crypto analytics firm Santiment, this capital inflow is proof that investor confidence is starting to grow again.
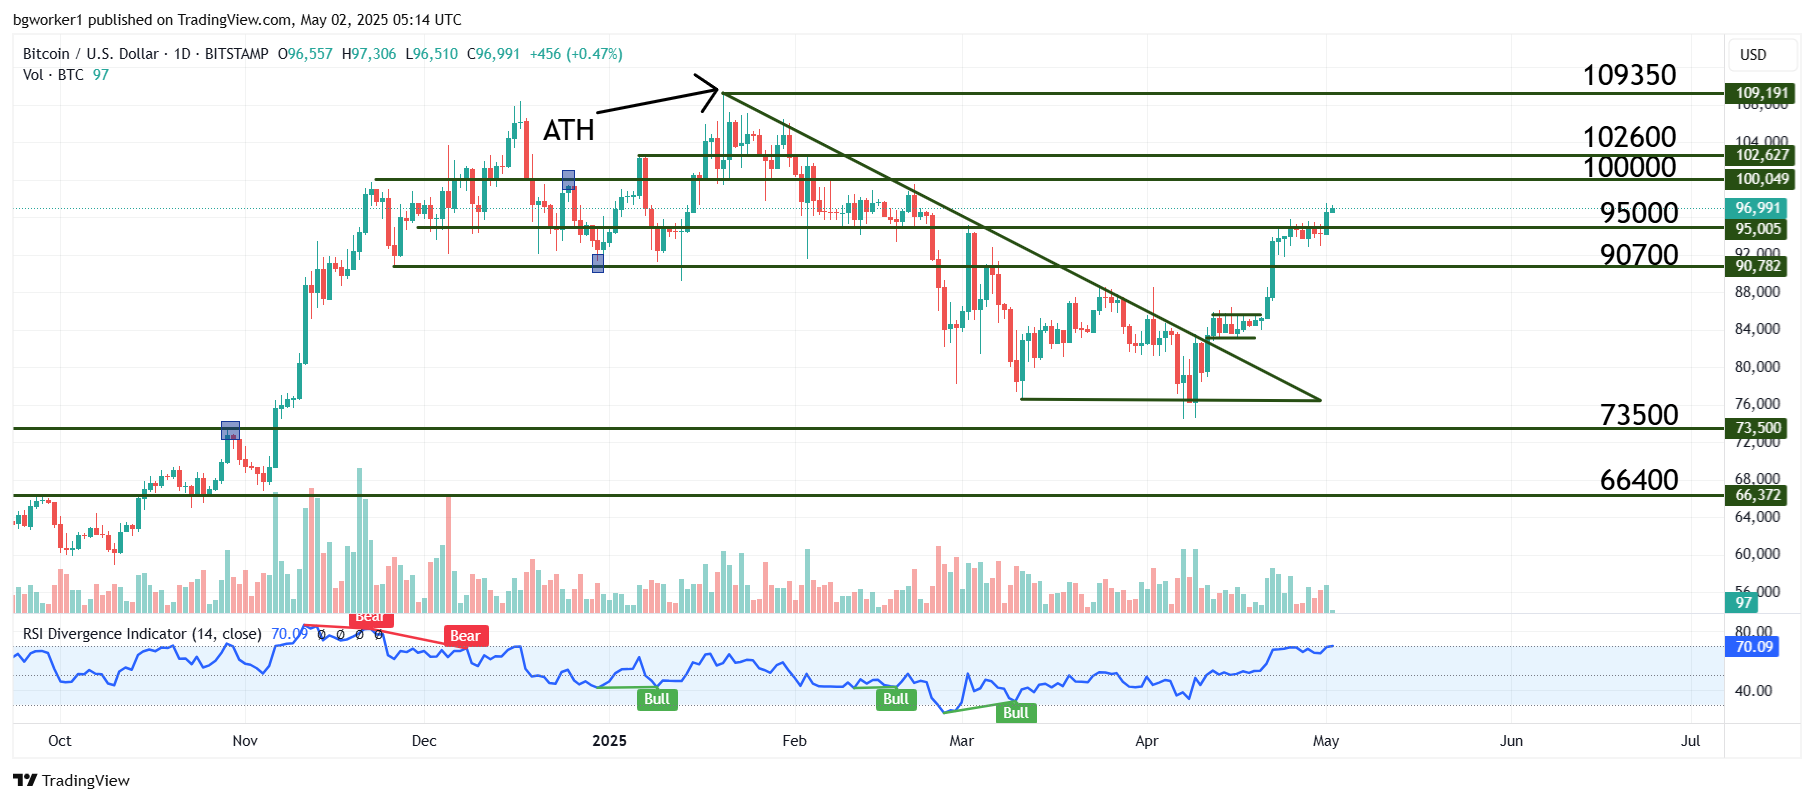
Chart Analysis – BTC/USD
Given Bitcoin’s recent breakout, it’s fair to look at $100K as the next destination. After all, the price just broke through $95K after spending a few days accumulating and the RSI is not yet overbought (albeit it is very close to overbought).
But if we look at the situation from another perspective, the current move actually started just above $74K, it stalled after breaking the long-term trend line and then accelerated to $95K. Then it broke $95K but it never retraced or corrected since its beginning; all the bears managed to do was stall the price and move it sideways. In other words, the current move may be too overextended to reach $100K.
If $100K is reached, expect a pullback from that zone. The bulls may remain in control but they are likely to take some profits at this milestone level, which will send the price lower.