Bollinger Bands, Volatility And You
Bollinger Bands, Volatility And You
Bollinger Bands ™ are one of the most dynamic and versatile trading tools on the market. The indicator was created by John Bollinger in the early 1980’s and captures one of his deepest insights. The idea that volatility was not static, that it changed from day to day, a thought contrary to popular market belief at the time. The tool presents as an envelope, similar to moving average envelopes, Keltner Channels and others but is based on measures of volatility. The bands are created from a standard deviation of price movement over a set period of time, much like basic volatility indicators such as historic and relative volatility. In my opinion, this is the best tool for measuring volatility but also a great tool for binary options traders to understand. It can be used in a wide variety of ways, gives of a number of easily recognizable signals and can be used as a stand alone indicator or with a package of other tools.
The tool is intended to show when prices are high or low relative to past price action. This means that prices are considered to be “high” when at the upper band and “low” when at the lower band. The indicator includes a total of three lines. The first is the central signal line, usually a simple moving average that is typically set to a period of 20. The same data used for the center line is then used to create the other two bands, the Bollinger Bands ™. These are a standard deviation of the central line, usually 2 but it, like the moving average itself, can be adjusted to your liking. Because the bands are based on a standard deviation of price movement they are highly sensitive to volatility in the market and change on a day to day basis as the mood of the market changes. The bands will expand when volatility is high and contract when volatility is low. Signals can be given when prices reach, cross or exceed any of the three bands or when the bands expand and contract, or a combination of the two. The thing to remember is that these signals are not tied to trend. The best use is as I have mentioned above, alongside other indicators, but here I will go over some of the basic signals that binary traders can use.
Simple And Profitable Bollinger Band Signals ™
The most signal is the simple expansion and contraction of the bands themselves. This represents increases and decreases in market volatility. When compared to price action and other indicators these swings can be powerful confirming indicators. For example, the bands have narrowed and the market trended in a tight sideways range and then the bands begin to widen. The widening of the bands means that volatility is beginning to creep into the market, suggesting a stronger move than “normal”. Your complimentary analysis tells you the market is about to sell off so you can assume that the move will be to the downside. Additionally, if the market has been trending and the bands are very wide, then begin to contract, you can assume that the trend is cooling off and then look for entries to suit.
You can also use the bands themselves to give signals. The rules for this vary from trader to trader and style to style, a sign of how adaptable the tool is. The following rules are more like suggestions and should be applied carefully when you first begin to use them with your strategy. The first is that when the bands widen following a period of contraction and price moves to touch either band it is often an indication of direction. There may be a pullback following the first touch but so long as prices do not overly exceed the bands they can be expected to continue in that direction into the near term.
Another signals occurs after the bands begin to widen and volatility has picked up. Basically, the bands provide limits where the market is considered to be highly priced. Usually, when prices exceed the band on either side it signifies that market has gotten ahead of itself and prices are extremely high or extremely low and about to pull back. This signal is good for really short term entries. This signal is incredibly accurate when used with Fibonacci Retracements or other support/resistance analysis.
A third signal useful for trades is the moving average cross. Price action can be expected to move from extreme to extreme regardless of the amount of volatility in the market. As prices trend higher, lower or sideways they will approach the center moving average and give signals. This could be a crossover which means that prices are likely to continue to the opposite band or they will be reversals, and prices will move back to the band they just left.
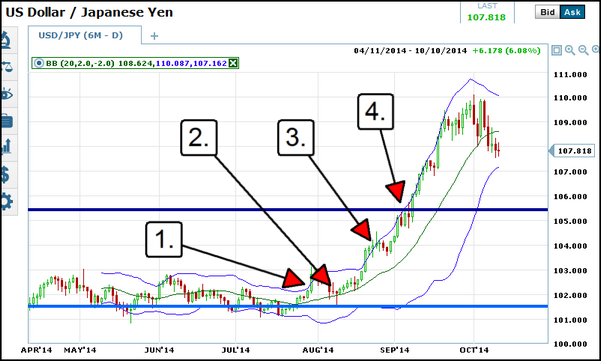
Look at the chart above. At point 1 price move from a period of low volatility to high volatility, indicating a move is on the way. They hit the upper band but exceed it, indicating the trend is up but that prices may pull back first. At point 2 prices have pulled back, to the center signal line, where they bounced in line with the original indication at point 1. At this time prices move higher again but at point 3 again exceed the band and indicate a pull back. The next pull back was mild, but tradeable, and lead to another trend following entry. Now, at point 4 prices are brushing the upper band but not exceeding it, indicating the trend is up and strong, but not overly priced with no indication of a pull back. When prices meet resistance it fails, as indicated by the Bollinger Bands ™.