Bitcoin’s Ups and Downs: New All-Time High Achieved
The $10,000 Pullback – Is It Enough?
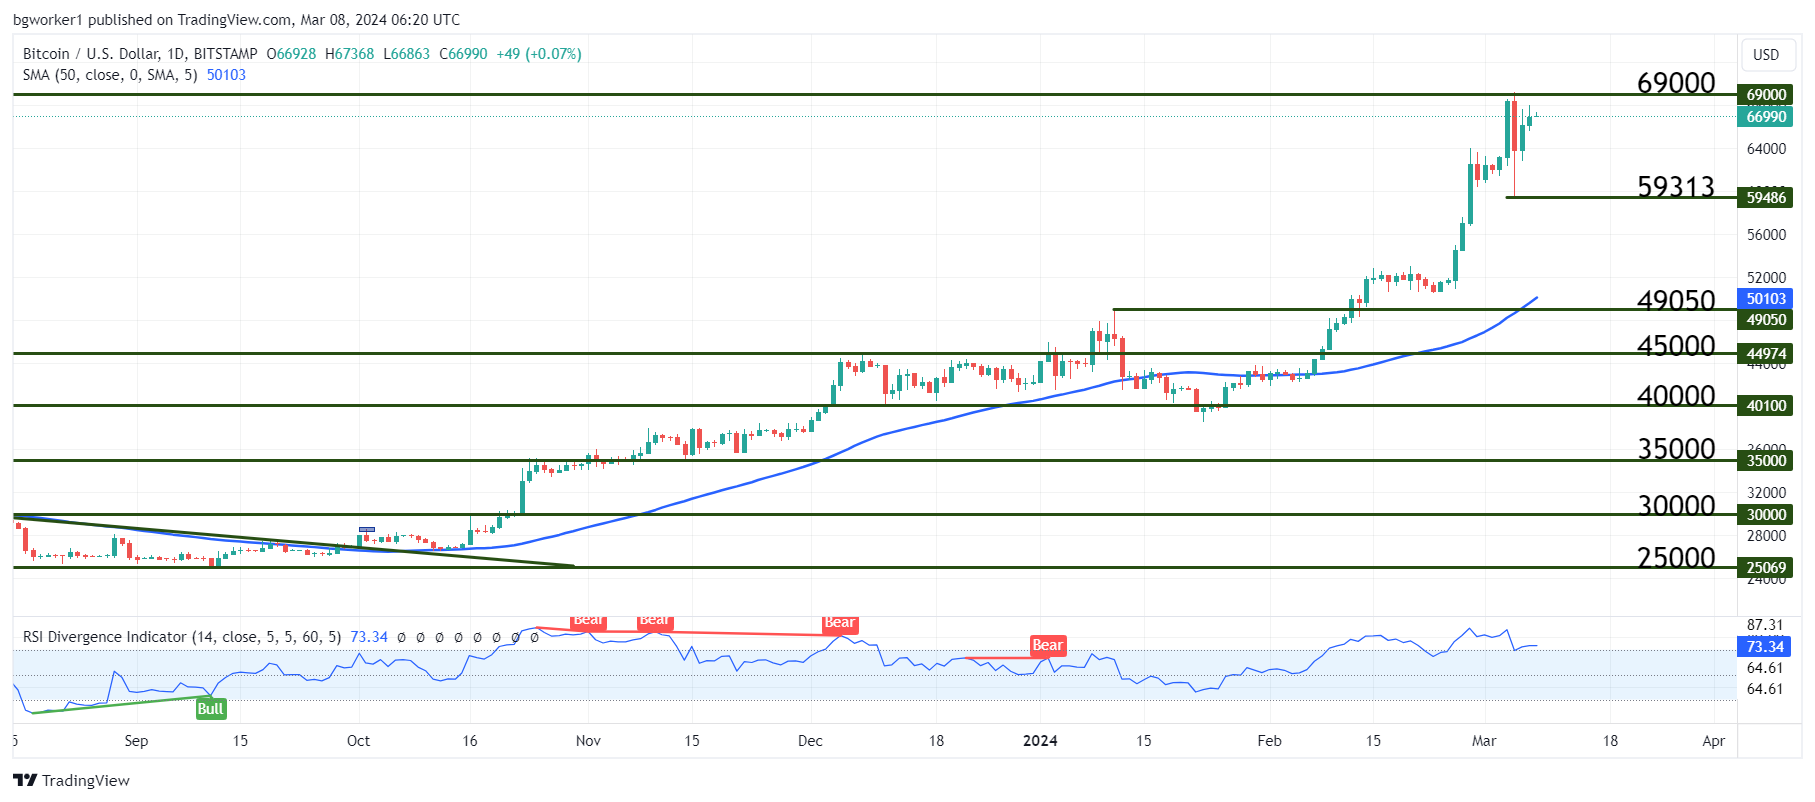
On the 5th of March, the apex cryptocurrency reached its newest All-Time High of $69,210, surpassing the previous ATH by just $210. Of course, depending on what chart you are looking at, this can differ because some exchanges list the previous ATH at $68,900 and the new ATH around $69,300. Either way, it was a rollercoaster and as soon as the peak was reached, Bitcoin collapsed by almost $10K in just a few hours, reaching a low of $59,313. At the time of writing it is trading around $67,000, so most of the losses have been erased.
Since November 2021, Bitcoin has had a wild journey, moving from almost $70,000 to around $15,500 and now back into the $70,000 area. On November 10, 2021, Bitcoin hit $69,000, a significant moment in cryptocurrency history. But it was all downhill from there and each “buy the dip” trade was likely faced with liquidation. First, it went to $50K, then to $40K, and as low as $33K before climbing back into the $48K area. To some it looked like BTC was back on the horse… but that was far from being true.
Soon after, BTC plummeted to the $15,500 area, wiping out previous gains. This decline coincided with events like FTX’s bankruptcy, hitting a low point for many. However, by June of 2023, Bitcoin began to show signs of recovery, reaching $30K and fueling optimism.
The Rally
Despite the challenges of the previous year, the mood among crypto enthusiasts turned overwhelmingly positive by January 2024. The approval of spot Bitcoin ETFs by the SEC, while causing an initial price drop, signaled a market turning point. On February 26, 2024, Bitcoin surged to around $55K due to renewed optimism and market momentum. The rally continued and Bitcoin reclaimed $60,000 before March and peaked at a new all-time high of $69,210 on March 5, 2024. The rally was driven by factors such as consistent institutional investment, notably from the U.S., following the approval of spot Bitcoin ETFs, which makes it different from the 2021 rally.
Chart Analysis – BTC/USD
As we look towards April 2024, the future remains uncertain. While Bitcoin has previously faced setbacks after testing the $70,000 mark, the upcoming halving event could have a significant impact on the market, influencing traders and investors alike.
The fact that BTC just printed a new ATH (albeit it breached the previous by just a few hundred dollars) is still a very bullish sign and something that sparks interest for the digital king. It’s true that a massive rally is often followed by a pullback but we just had a $10K pullback. Many whales and institutions saw that as a golden opportunity to buy at a discount, which means the top will be breached, potentially.