Bitcoin’s Rise Hindered by US Dollar Strength.
Bullish Breakouts Still on the Table
by Bogdan Giulvezan
Throughout this week the US Dollar has been strengthening against most of its major counterparts, most notably against the Euro and the Yen. The Dollar Index (DXY) is currently trading in close vicinity of 92.00, after successfully breaking through the key resistance levels at 91.00 and 91.50.
This newfound Dollar strength has been an important factor that hindered further Bitcoin advances and dragged BTC/USD lower, into the $46,600 range. The “digital gold” lost more than 5% over the last 24 hours, although it’s still up almost 4% over the last 7 days. However, the key support at $45,000 is still intact and last week we saw that bullish pressure is still present because a dip below the said support level was short-lived and price quickly returned above it.
Most of the other top 10 altcoins have incurred losses, with Binance Coin (BNB) dropping almost 9% yesterday, currently trading at $221, Polkadot (BNB) dropping almost 11% and Cardano (ADA) 7%. The charts are showing lower highs and although bearish pressure is present, price action is still indicative of an accumulation phase, not a full-on bearish market. That being said, let’s take a closer look at Bitcoin’s chart because usually, it is a leading indicator of how altcoins will behave.
Chart Analysis – BTC/USD
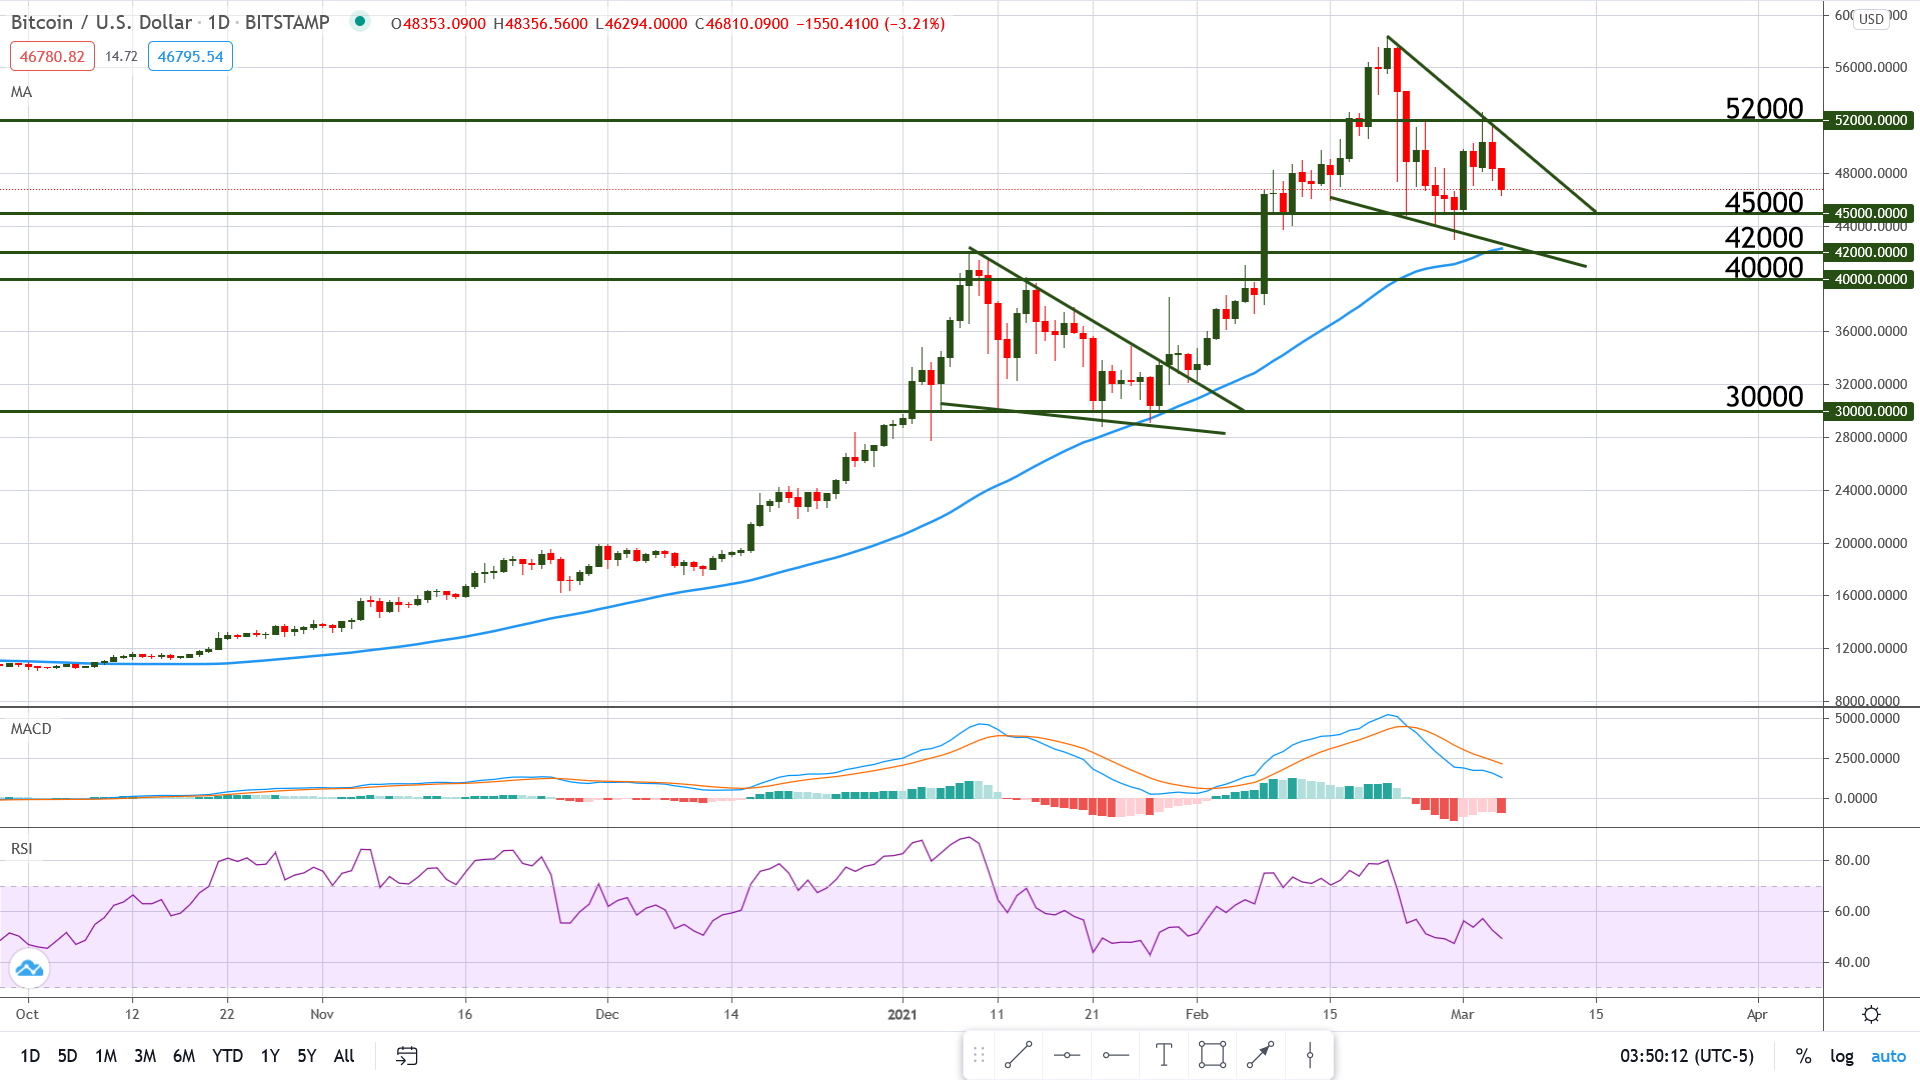
After printing an all-time high above $58,000, Bitcoin retreated and failed to challenge the same price, being rejected at $52,000 resistance. On the 4 hour charts, price shows a double top around $52K, which is an indication that we are dealing with a strong level, which will be difficult to break. On the other hand, a break of the said level will indicate strong bullish pressure and possibly another attempt to break $58K.
Looking at the Daily chart below we can see that a wedge is forming and this looks very familiar to what happened in January 2021, when a similar formation appeared. After the break of the previous wedge, price printed a significant higher-high and since technical analysis predicts future movement based on past behaviour, we can assume that a break of the current wedge will trigger another bull run and a new ATH.
The Relative Strength Index is headed down, and the same is true for the MACD, which may suggest that price is going to drop once again into the support located around $45,000. We may see a bounce higher if it gets there but on the other hand, it’s possible that Bitcoin will experience an extended period of sideways movement, speaking strictly from a technical perspective, without taking into account outside catalysts such as news, rumors, etc.