Bitcoin’s Pullback Has Started! Is It a Good Thing?
Fed Chair Powell: We Could Raise Rates Higher Than We Expect.
Last week’s Non-Farm Payrolls data came out much better than anticipated, taking everyone by surprise, including the Fed and its Chair, Jerome Powell. In a discussion hosted Tuesday by the Economic Club of Washington, Fed’s Powel made it clear: We didn’t expect the jobs report to be this strong.
The Chair then continued by saying: The reality is that we’re going to react to the data, if we get stronger data, we could raise rates higher than we expect. And repeated that although the disinflationary process has started, more rate hikes are needed.
Powell’s comments put a direct focus on next week’s Consumer Price Index and its Core version, which are the main gauges of inflation. The Fed’s actions have managed to put a dent in the soaring inflation but a higher CPI will be a sign that more restrictive measures (higher rates) will follow.
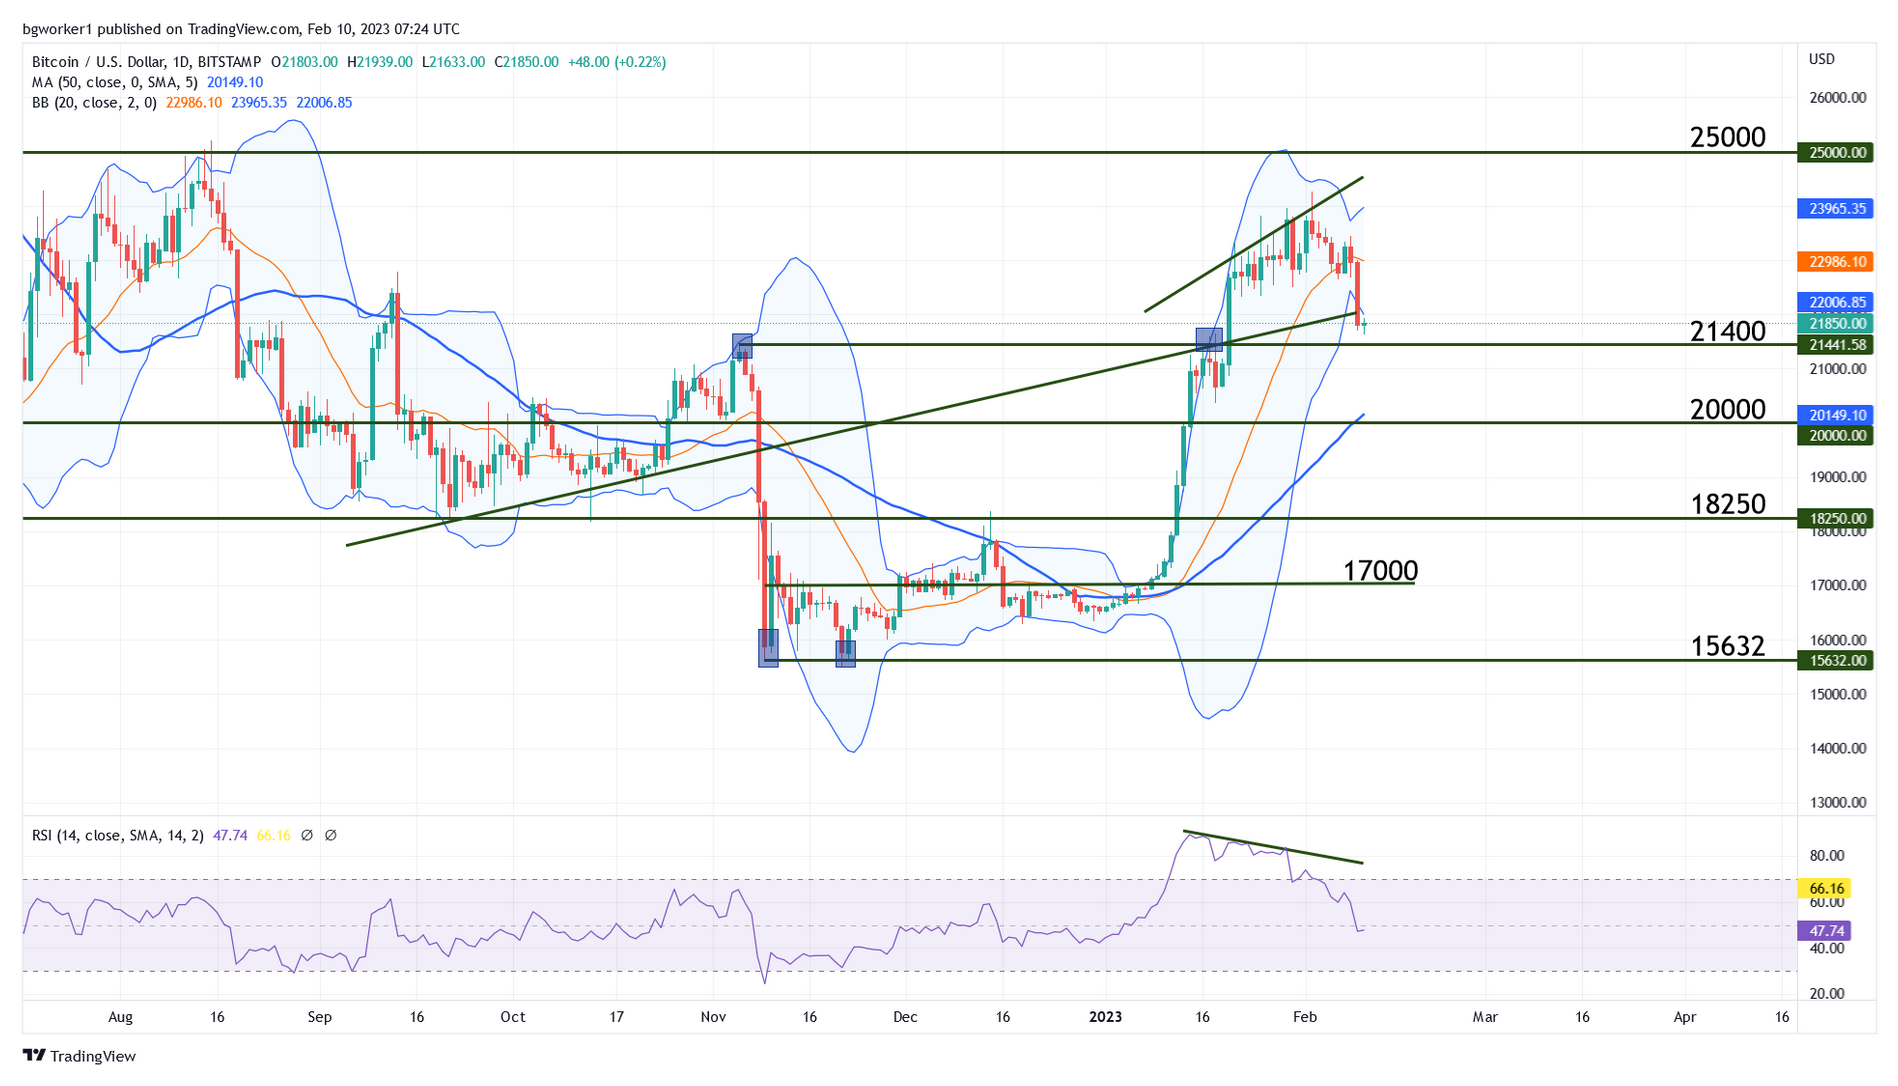
Bitcoin has been climbing for the entire of 2023 thus far and a pullback was imminent. The stellar NFP report sent the US Dollar higher, triggering the said pullback in BTC/USD. The apex cryptocurrency was changing hands at around $23,500 before the NFP and now it is trading at $21,900.
Chart Analysis – BTC/USD
The pair was showing multiple signs that it is getting ready for a drop, which materialized this week. Bearish divergence was present: Bitcoin was making higher highs while the RSI was making lower highs. Also, the candles started to show signs of indecision and even rejection: multiple Doji candles (small bodies and long wicks on both sides) and even a few pinbars (small body, long wick on the upper side).
A pullback is “healthy” in an uptrend and now the pair is facing multiple forms of support: the bullish trend line, the lower Bollinger band and it is approaching the $21,400 level. The Bollinger Bands are expanding (moving in opposite directions), which is a sign that the current move may extend further, or at least that it will not reverse on a dime.
A key point, in my opinion, is the support at $21,400. This is the place where the FTX drop originated and we can see that the price reacted to it the last time it touched it (mid-January). The current bearish move is likely to extend into the $21,400 area, possibly even lower, into the 50-day Moving Average. The way the price behaves there will offer important clues about the future price action.