Bitcoin Will Soon Be At $60,000
Bitcoin Is on Fire: $52K and Still Pumping!
by Bogdan Giulvezan
Currently trading at 51,800 against the US Dollar, Bitcoin is showing a small correction, after reaching another All-Time High at $52,520, according to data from CoinMarketCap. Given the current look of the chart, it seems that all dips are good opportunities to buy and each break of the previous peak triggers massive gains.
Although we are trading in uncharted territory as far as the upper side is concerned, Bitcoin shows good support levels, which is crucial for a bullish market because all uptrends need pullbacks and good levels to bounce off and resume the climb. The said levels are located at $50,000 as psychological support, $45,000 as technical support, and $42,000 as the previous high (which is also technical support).
The BNB Rocket
Crypto volatility is at an all-time high and almost all digital assets are flying, with Bitcoin leading the charge. However, percent-wise, there’s another star that shines brighter than ever: Binance Coin (BNB). Over the last 7 days, the coin added more than 110% and is currently trading north of $260.
During this massive climb, BNB flipped Tether and claimed the third spot in market cap rankings, currently sitting above $41 billion, versus Tether’s $33 billion. The gap between BNB and Ethereum is wide (ETH currently has a market cap north of $222 billion), so we won’t see another flip soon (if any), but for the time being it seems that BNB will retain the 3rd spot, especially considering that some analysts see it at $300 in the near term.
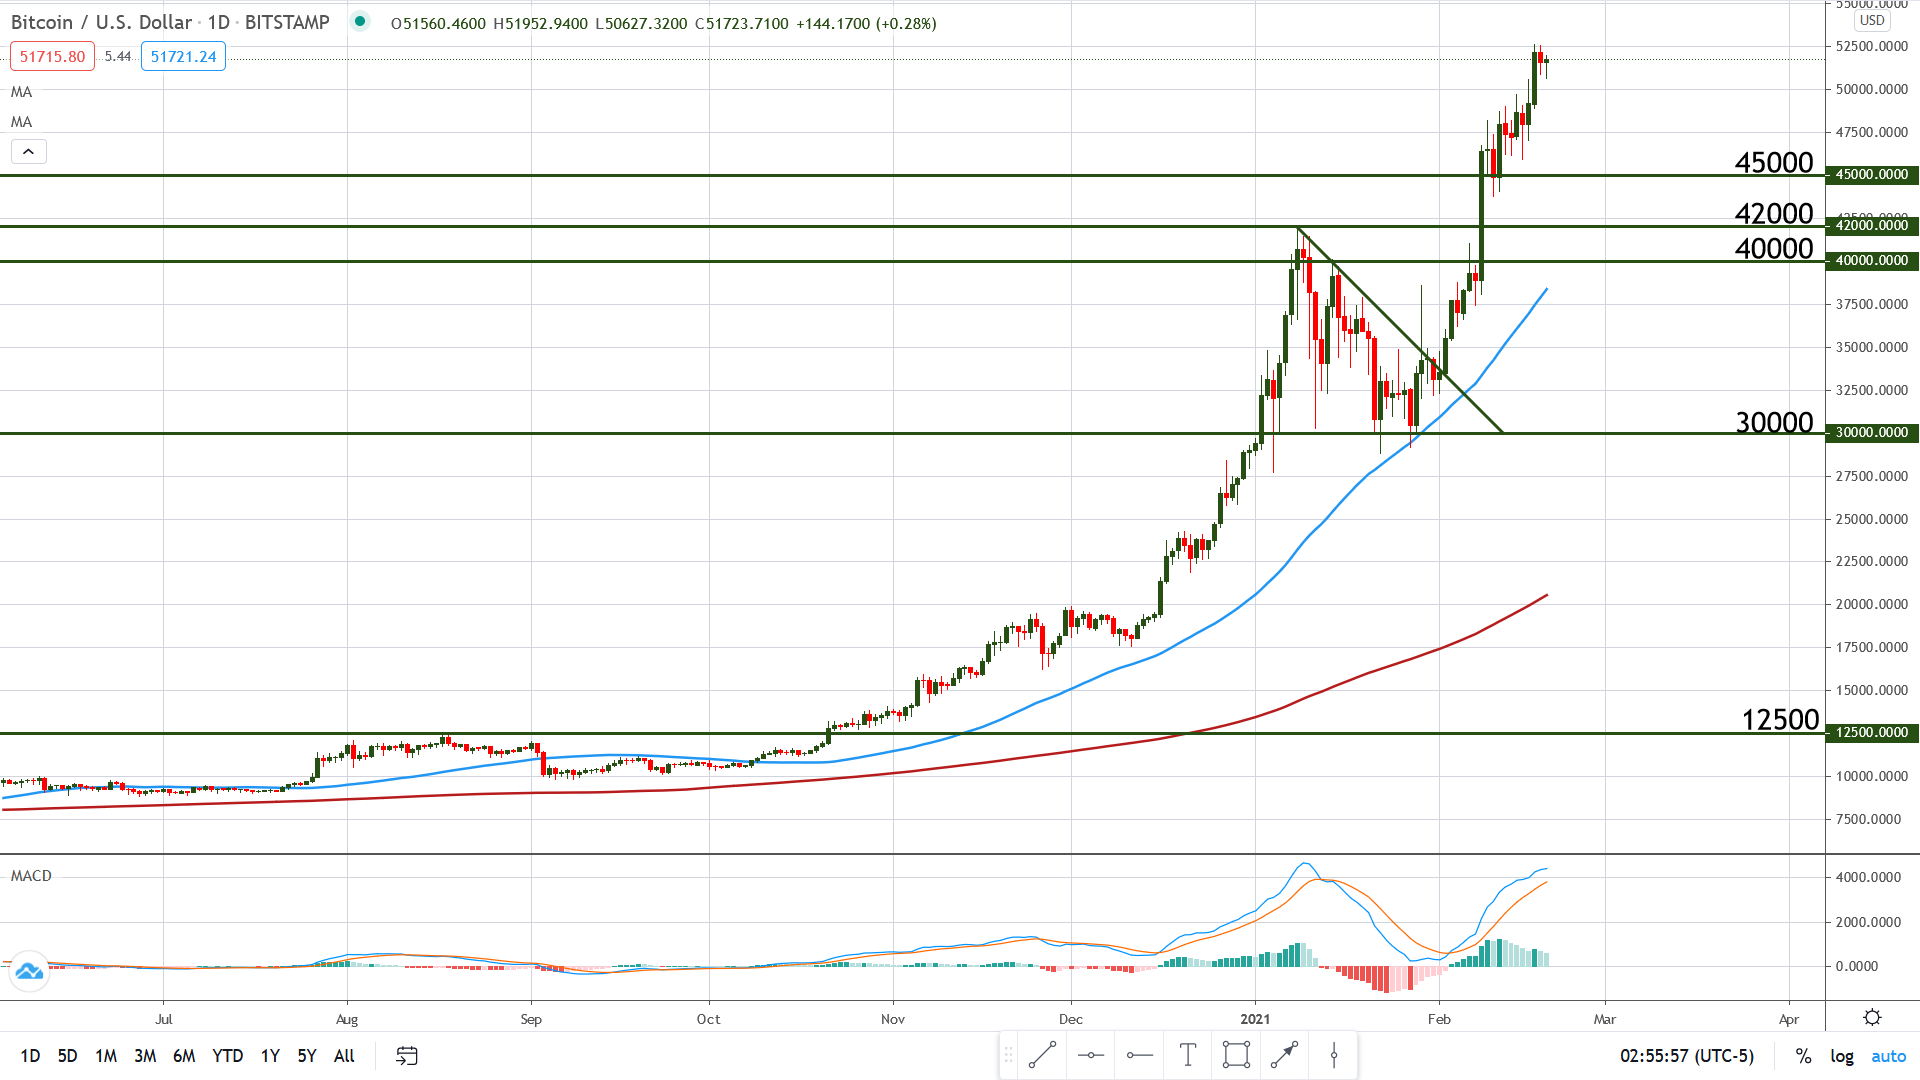
Chart Analysis – BTC/USD
After finding support at $30,000, Bitcoin shattered the previous peak and soared above $52,000, making the chart look as bullish as ever. As mentioned before, the climb has good support beneath it ($50K, $45K, and $42K), thus the bulls will probably remain in control for a good while.
But even if the trend remains bullish, this doesn’t exclude pullbacks, which are normal and actually healthy for long-term gains. On the Daily chart below, we can notice that price has already printed a higher high, while the MACD has failed to surpass its previous peak. This is known as regular bearish divergence and it usually acts as an early sign of a retracement. However, as long as price remains above the support levels mentioned earlier, the bias is definitely bullish.
Volatility is through the roof these days, thus we cannot exclude a sudden jump to $55K or even $60K, but this can work both ways, meaning that a drop below $50K is not out of the question either.