Bitcoin Tumbles Below the Psychological $50K Level
Fears of “Major Correction” in Play
by Bogdan Giulvezan
“What goes up, must come down” – it’s about the only thing that physics and financial charts have in common. Bitcoin’s massive 2021 rally is taking a breather, with the Digital Gold crashing below the key psychological level at $50,000 and currently trading at $47,920.
Although the exact reason is not 100% clear, some voices attribute the move to President Biden’s plan to raise capital gains taxes, which would undoubtedly affect the amount of fiat currency that people convert to cryptocurrency. However, for the time being, the plan is just speculation but as we know, the crypto market is very sensitive to FUD and that may be part of the reason behind the drop.
In light of recent developments, Scott Minerd who is a long-time Bitcoin bull but also investment manager at Guggenheim Partners considered the Digital King “very frothy” and warned that it may be prone to a “major correction”. He further stated that it “could pull back to $20,000 to $30,000… which would be a 50% decline”. It remains to be seen if Bitcoin will in fact drop that much, but we’ve seen it climb back up countless times, thus if history repeats itself, the decline will be erased.
The rest of the crypto market is feeling the effects as well, with more than $200 billion erased in a short while. The top currencies seem to be the most affected, with Ethereum shaving more than 10% off its price in 24 hours, ripple down almost 40% over the last 7 days, and Binance’s BNB returning below the $500 mark, currently trading at $485.
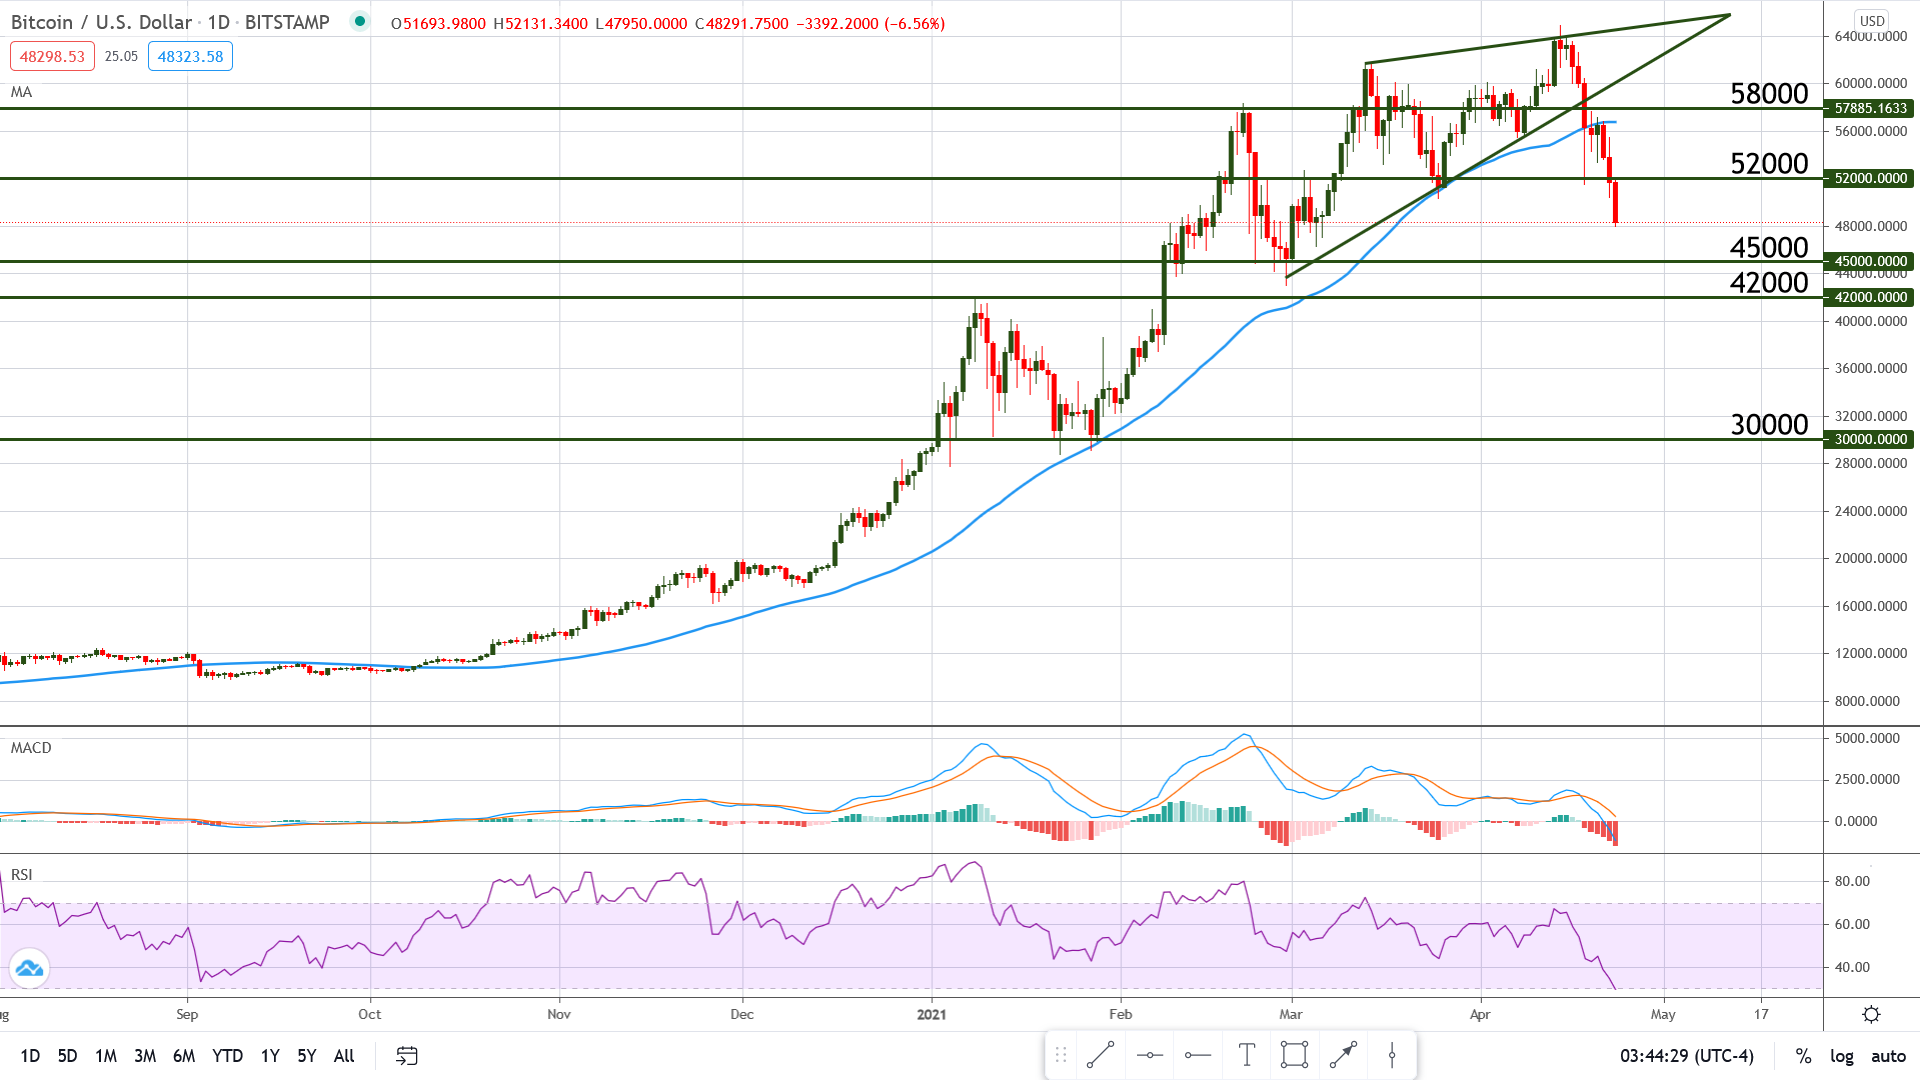
Chart Analysis – BTC/USD
After topping out at $64,895, Bitcoin started its descent and dropped through the technical support level at $52,000 as well as through the psychological level at $50,000. More importantly, the pair broke the previous significant low and thus created a lower low, which is a sign that the uptrend may be due for a deeper retracement or at least a longer one, time-wise.
The pair is trading below the 50 periods Moving Average, which further increases the chances of bearish price action. Also, it’s worth mentioning that the MACD shows strong bearish momentum (lines spread apart, moving south) and the RSI is plummeting as well.
Considering the above, the current move may extend into the support located at $45,000 but if price gets there, it is likely to rebound, especially if the RSI will become oversold by that time.