BTC/USD Breakout – The Battle for $30K Is Still On
Bitcoin: The Beast Awakens… or Does It?
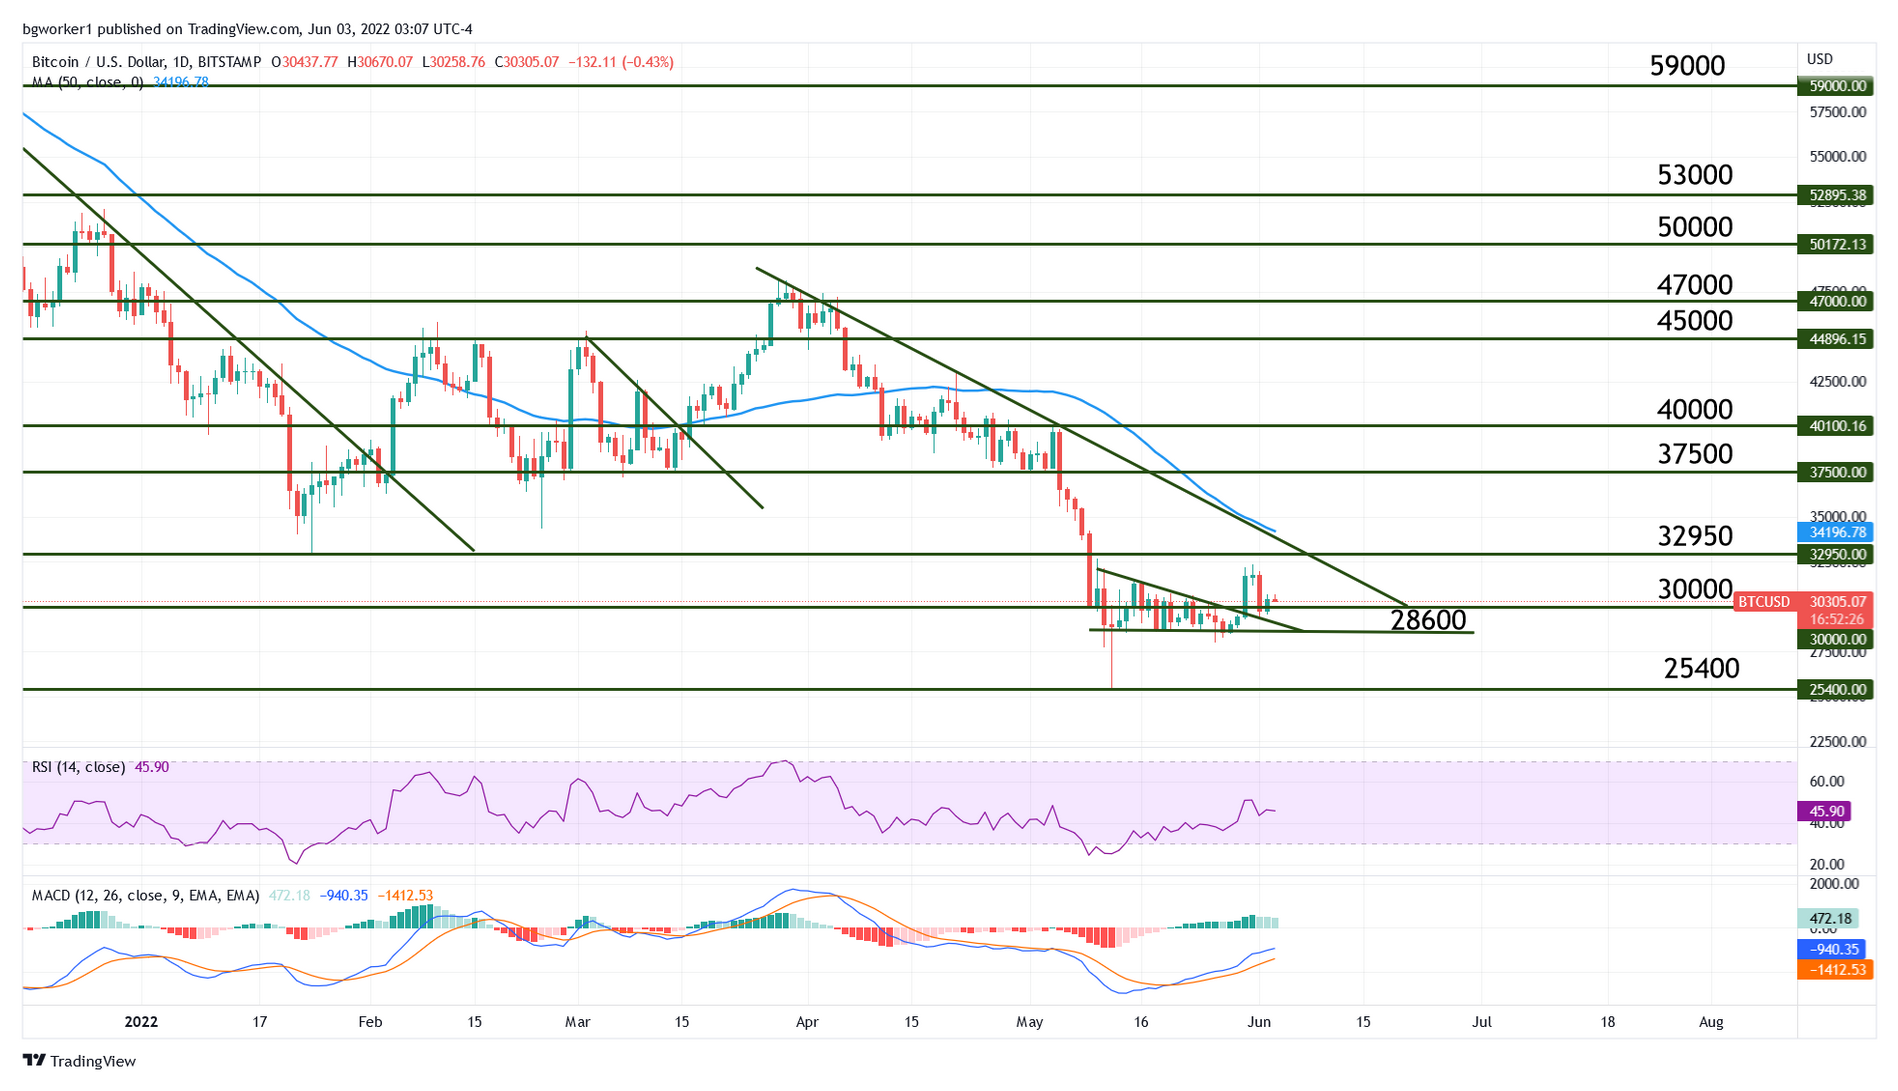
After spending more than two weeks inside a descending bearish triangle, Bitcoin managed to escape the pattern by breaking its upper barrier. This also marked the break of the key level at $30,000, which was a very bullish sign; however, the break was short-lived and the majority of the gains were erased. The flagship cryptocurrency is currently trading at $30,300 after reaching a high of $32,375.
It is common for an asset to return to a recently broken level for a so-called “re-test”, which will play an important role in the future movement. If the price moves back below the level, it means that the initial break was false and that the bulls lack the necessary strength to follow through and solidify their victory. It also means that a period of bearish movement will follow.
On the other hand, if the re-test results in a bounce higher, it means the initial break was a true one and also confirms the broken level as support for future price action. At the time of writing, the outcome of the re-test scenario is not known because the pair is trading right on the level and basically anything can happen.
What is clear though, is that Bitcoin is finally showing signs of increased volatility. It spent more than two weeks inside the bearish triangle, with very limited action, small candles, and zigzag motion. But during the day of the initial break (May 30) price moved almost $3,000, which was huge compared to the previous days that had <$500 movement. The gains were erased on June 1st, which was another day with big volatility. This could mean that Bitcoin is finally awakening from its slumber and hopefully this volatility surge won’t fizzle out quickly.
Chart Analysis – BTC/USD
The recent price action has confirmed $28,600 as an important support level for the future. The level is also the bottom side of the bearish triangle, which gives it extra importance. The fact that BTC/USD bears have tried several times to break it and failed, confirms its significance.
Another key element is of course the $30,000 level, which is now being tested. A bounce higher from here would send Bitcoin into the 50-day Moving Average and bearish trend line seen on the chart. A move above this confluence zone would mark a major victory for the bulls but it’s probably too early to talk about that.