Bitcoin: The Battle for $30K Is Lost… For Now
Bears Break April’s Low. Where to Next?
The latest U.S. inflation data released Wednesday provided further evidence that the Fed might not continue hiking interest rates to curb inflation. The Core CPI (year over year) came in at 5.5%, lower than the previous 5.6%, while the headline CPI (year over year) was 4.9%. Both the previous and the forecast were 5%.
Since cryptocurrencies are considered risk-sensitive assets that tend to suffer in a high-rate environment, this news is positive. But while the first reaction was in line with the expectations of the bulls, Bitcoin soon succumbed to the bears’ pressure. It is a bit concerning that Bitcoin didn’t manage to challenge $30,000 despite this positive news.
The PPI numbers that came out a day after the CPI also showed that inflation may be toning down. According to the latest readings from CME’s FedWatch tool, there’s a 96% probability that the Federal Reserve will pause the rate hikes in June.
Yet despite all this, Bitcoin is still losing the battle against the US Dollar. This suggests that there may be other factors at play that are messing with Bitcoin’s bullish path. At the time of writing, BTC/USD is trading at $26,170 and it just broke April’s low and the previous support at $27,000.
Although the bears are shifting into a higher gear, some analysts still see Bitcoin on an upward path in the longer run. Some of their reasons are the increased network activity and overall market recovery.
Increased network activity indicates that interest in Bitcoin is on the rise, which may lead to a higher price. Also, the crypto market in general looks to be in a cycle of recovery from recent setbacks. This could generate bullish advances but for the short term, BTC is bearish.
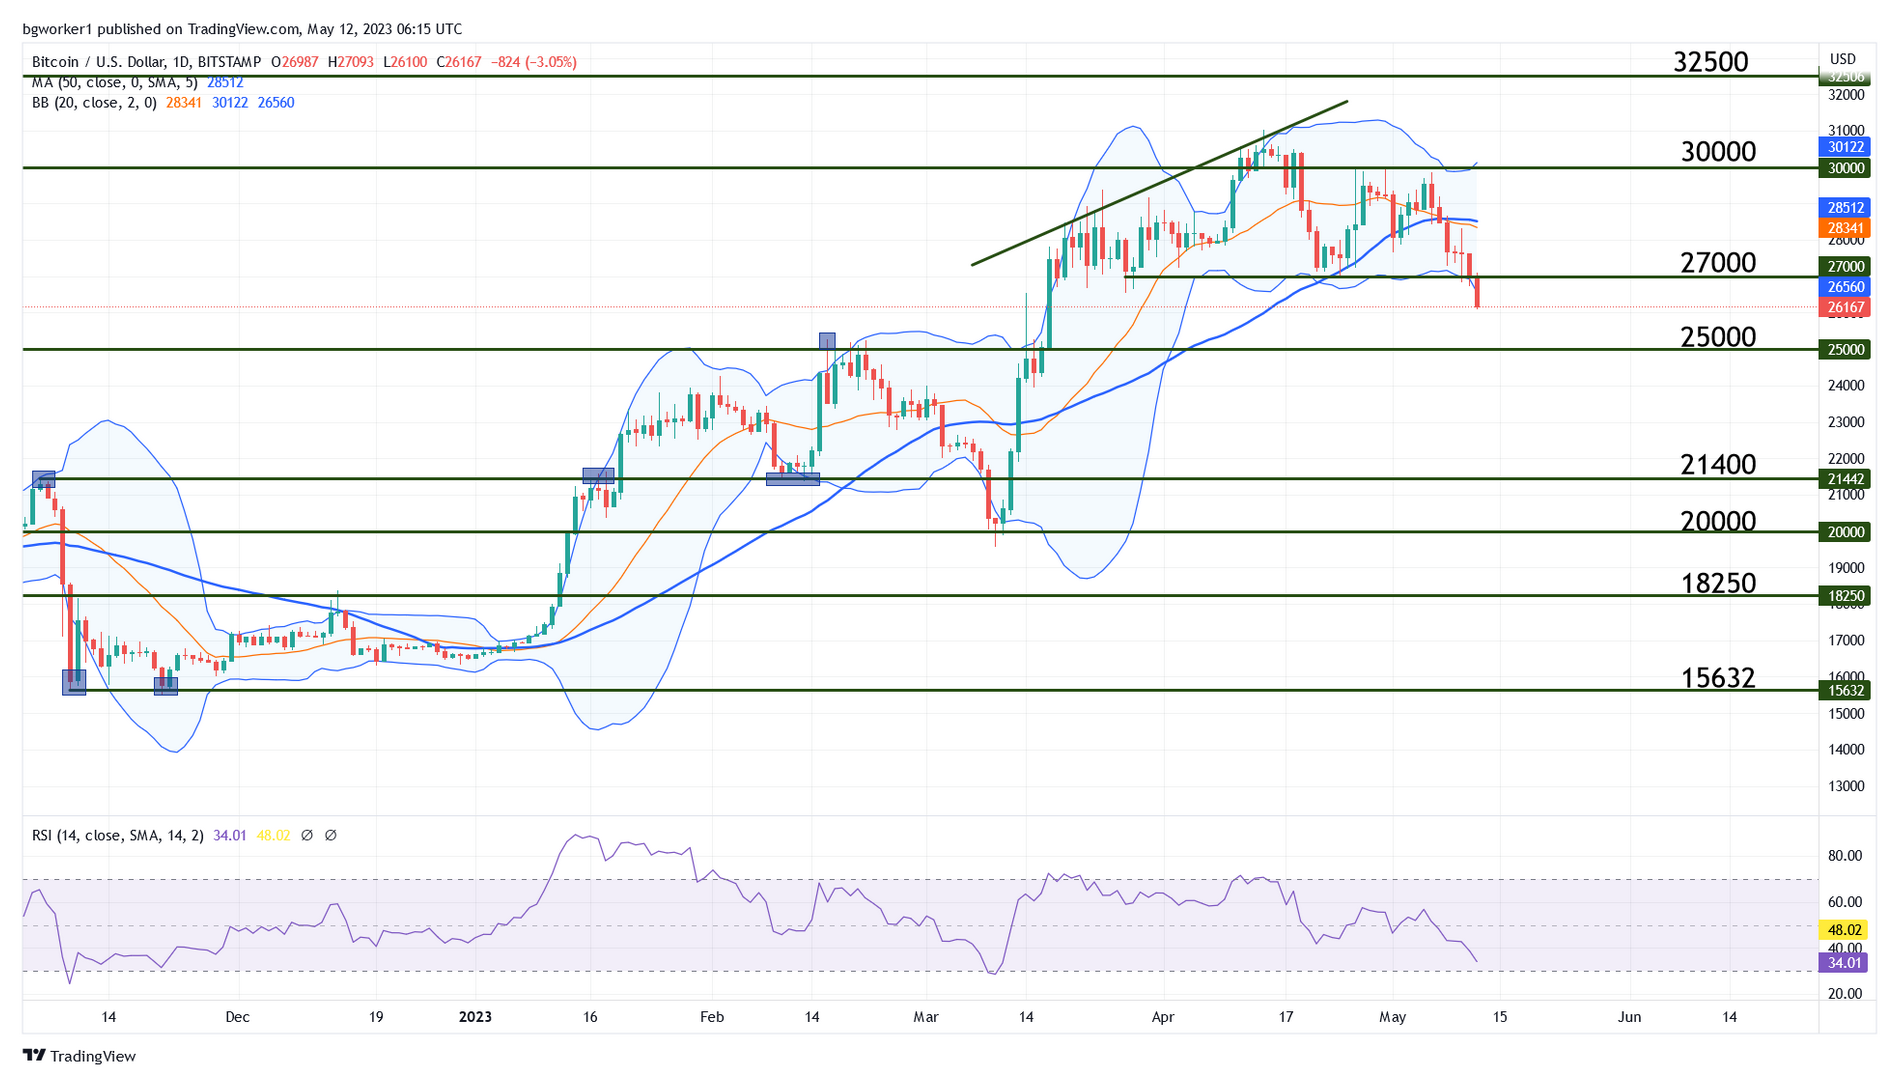
Chart Analysis – BTC/USD
After several attempts to break the key resistance at $30,000, Bitcoin printed a few lower highs and eventually broke down below $27,000. BTC/USD is currently trading at $26,170 and bearish momentum seems to be high.
The Relative Strength Index is approaching its 30 level, which indicates oversold. When or if this level is touched, we may see some bullish activity. The pair is also touching the lower Bollinger Band, which could also generate a bullish bounce. However, the two bands are moving in different directions, which is indicative of increased momentum (bearish in this case).
If BTC/USD starts a recovery, this is more probable to happen at a key level, where two or more elements come into play. For example, at $26,000 or $25,000, with the price sitting on the lower Bollinger Band and the RSI oversold.