Bitcoin Speeds Past $13,000
ECB Announces New Stimulus Package
by Bogdan Giulvezan
Bitcoin traded above $13,000 for the most part of the current week, reaching prices north of $13,800 on some exchanges. The biggest pullback of the week occurred Wednesday, as investors across the world were troubled by reports of an increase in COVID-19 cases and new lockdown measures adopted by some countries.
As the traditional market has been extending losses within the context of economic uncertainty and the overall gloomy mood generated by surging coronavirus cases, Bitcoin’s demand has grown, especially among institutional investors. Soon after the ECB press conference held Thursday, the number 1 digital asset recovered losses and stabilized above $13,000.
One of the possible catalysts behind the recent Bitcoin surge is the decline in the number of jobless claims coming from the US, which dropped last week to the lowest since the beginning of the pandemic.
Another catalyst is likely ECB’s decision to add new stimulus to the economy, in December. The European Central Bank stated: “The Governing Council will recalibrate its instruments, as appropriate, to respond to the unfolding situation and to ensure that financing conditions remain favorable to support the economic recovery and counteract the negative impact of the pandemic on the projected inflation path.”
Furthermore, ECB President Lagarde underlined that the ECB will use every tool at its disposal to help contain the pandemic and the negative effect that it has on the economy. In other words, we can expect more monetary stimulus by the end of the year.
Chart Analysis – BTC/USD
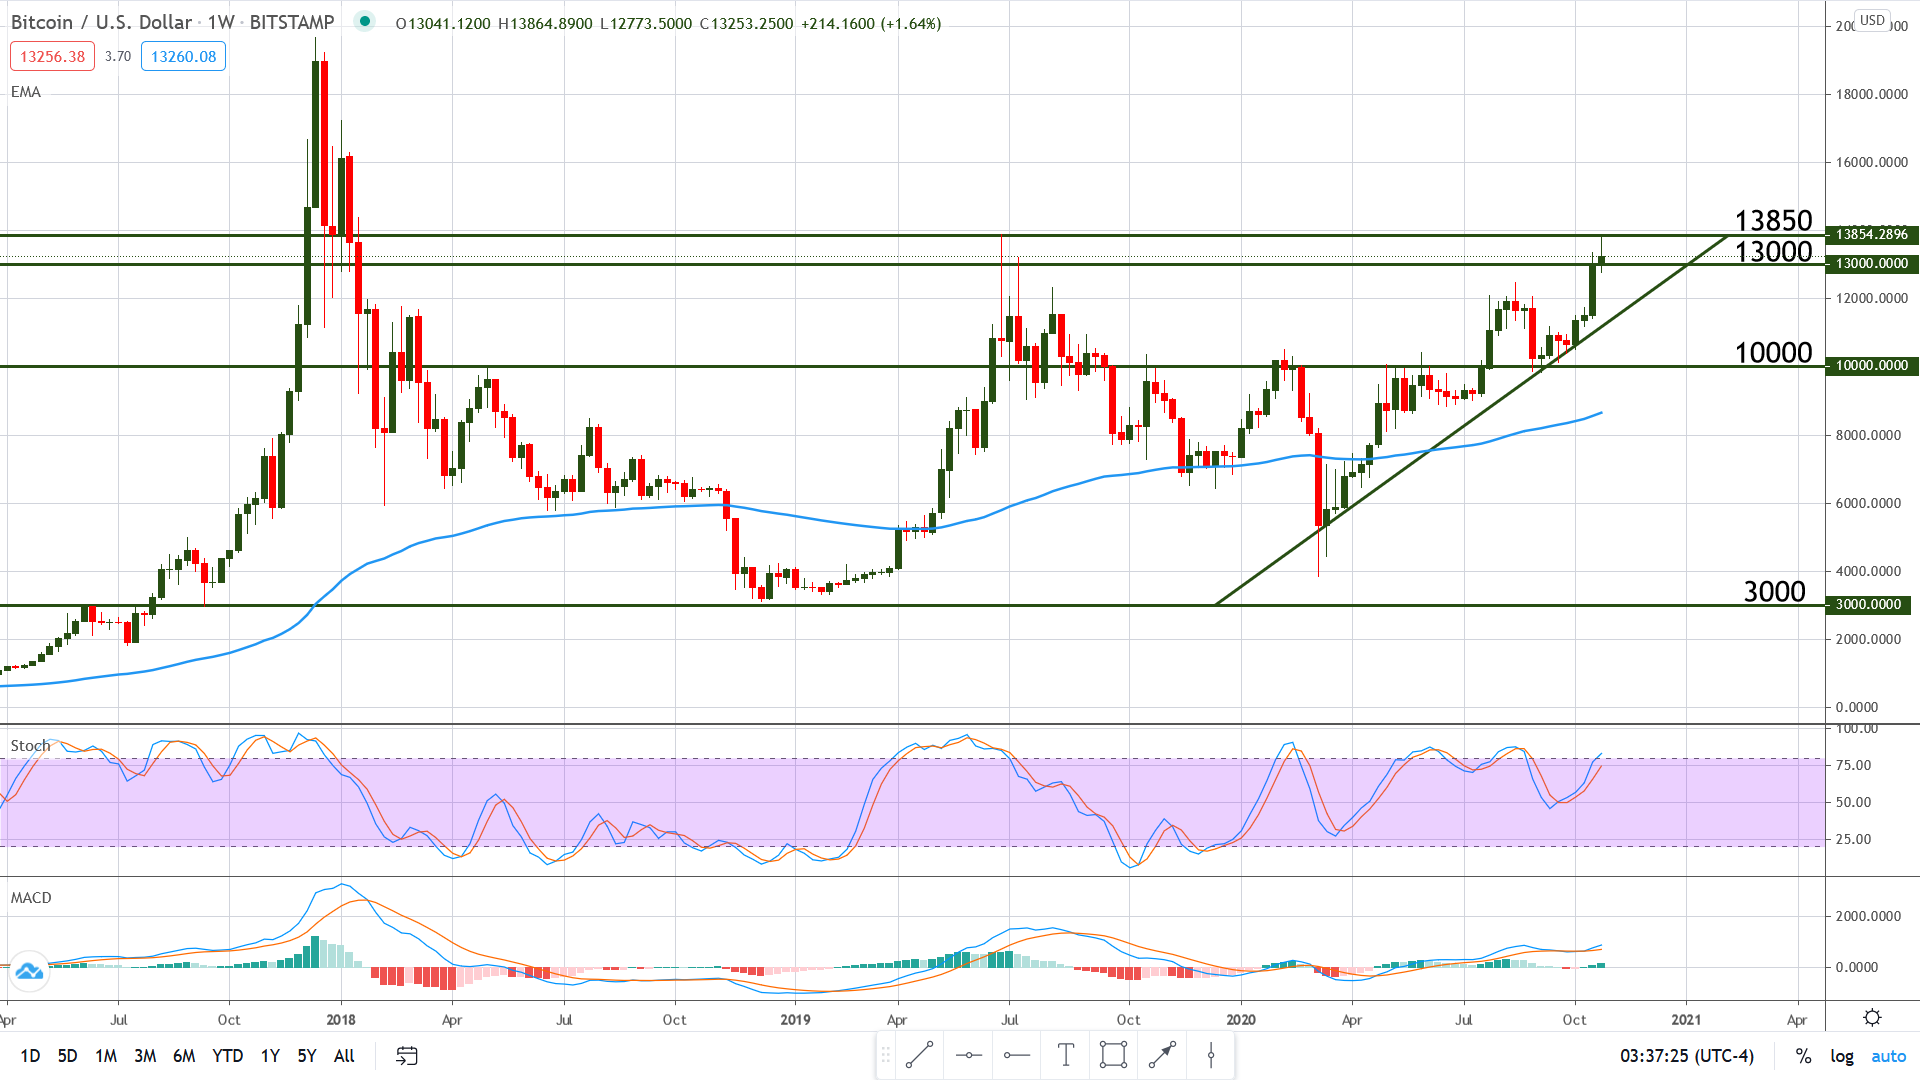
Bitcoin added 2.77% over the last 7 days and is currently trading at 13,300 against the US Dollar with a bullish bias and above key support. However, as we can note from the Weekly chart below, price was already rejected from a very important peak, made in June last year: $13,850. On top of this, the Weekly candle is a bearish pin bar, which is usually a strong indication that a pullback will soon materialize (just keep in mind that the week is not yet over and the shape of the candle may change).
Furthermore, the Stochastic is showing regular bearish divergence: price is making higher highs while the oscillator is making lower highs. This is yet another indication that a pullback will soon follow but it does not offer an exact timeframe for when this move may start.
Although a retracement is likely to occur sooner rather than later, as long as price is trading above the trend line seen on the chart below, the medium-term outlook is bullish.