Bitcoin Pierces $20K Again. Is the Rally Sustainable?
DOGE Shows Revival Signs as Musk’s Twitter Acquisition Concludes.
After months of trading sideways, the meme coin DOGE is finally showing bullish signs, buoyed by Elon Musk’s Twitter takeover. The Shiba Inu-themed coin jumped from $0.063 to a whopping $0.085 in just three days and is currently trading at $0.074.
Many people seem to attribute this huge rally to Musk’s Twitter acquisition which was initiated on April 14 and was concluded on October 27, 2022. According to Wikipedia, the price paid was $44 billion. The Tesla CEO and now new owner of Twitter stated that he plans to introduce new features, make the algorithms open source, and promote free speech among other things.
DOGE pundits are now speculating (and probably hoping) that the coin will become a payment method on Twitter. Musk has long been a vocal supporter of DOGE and even allowed Dogecoin payments on the Tesla merchandise store. But while the recent rally can turn into an uptrend, we cannot speak about a definite recovery of the meme coin just yet.
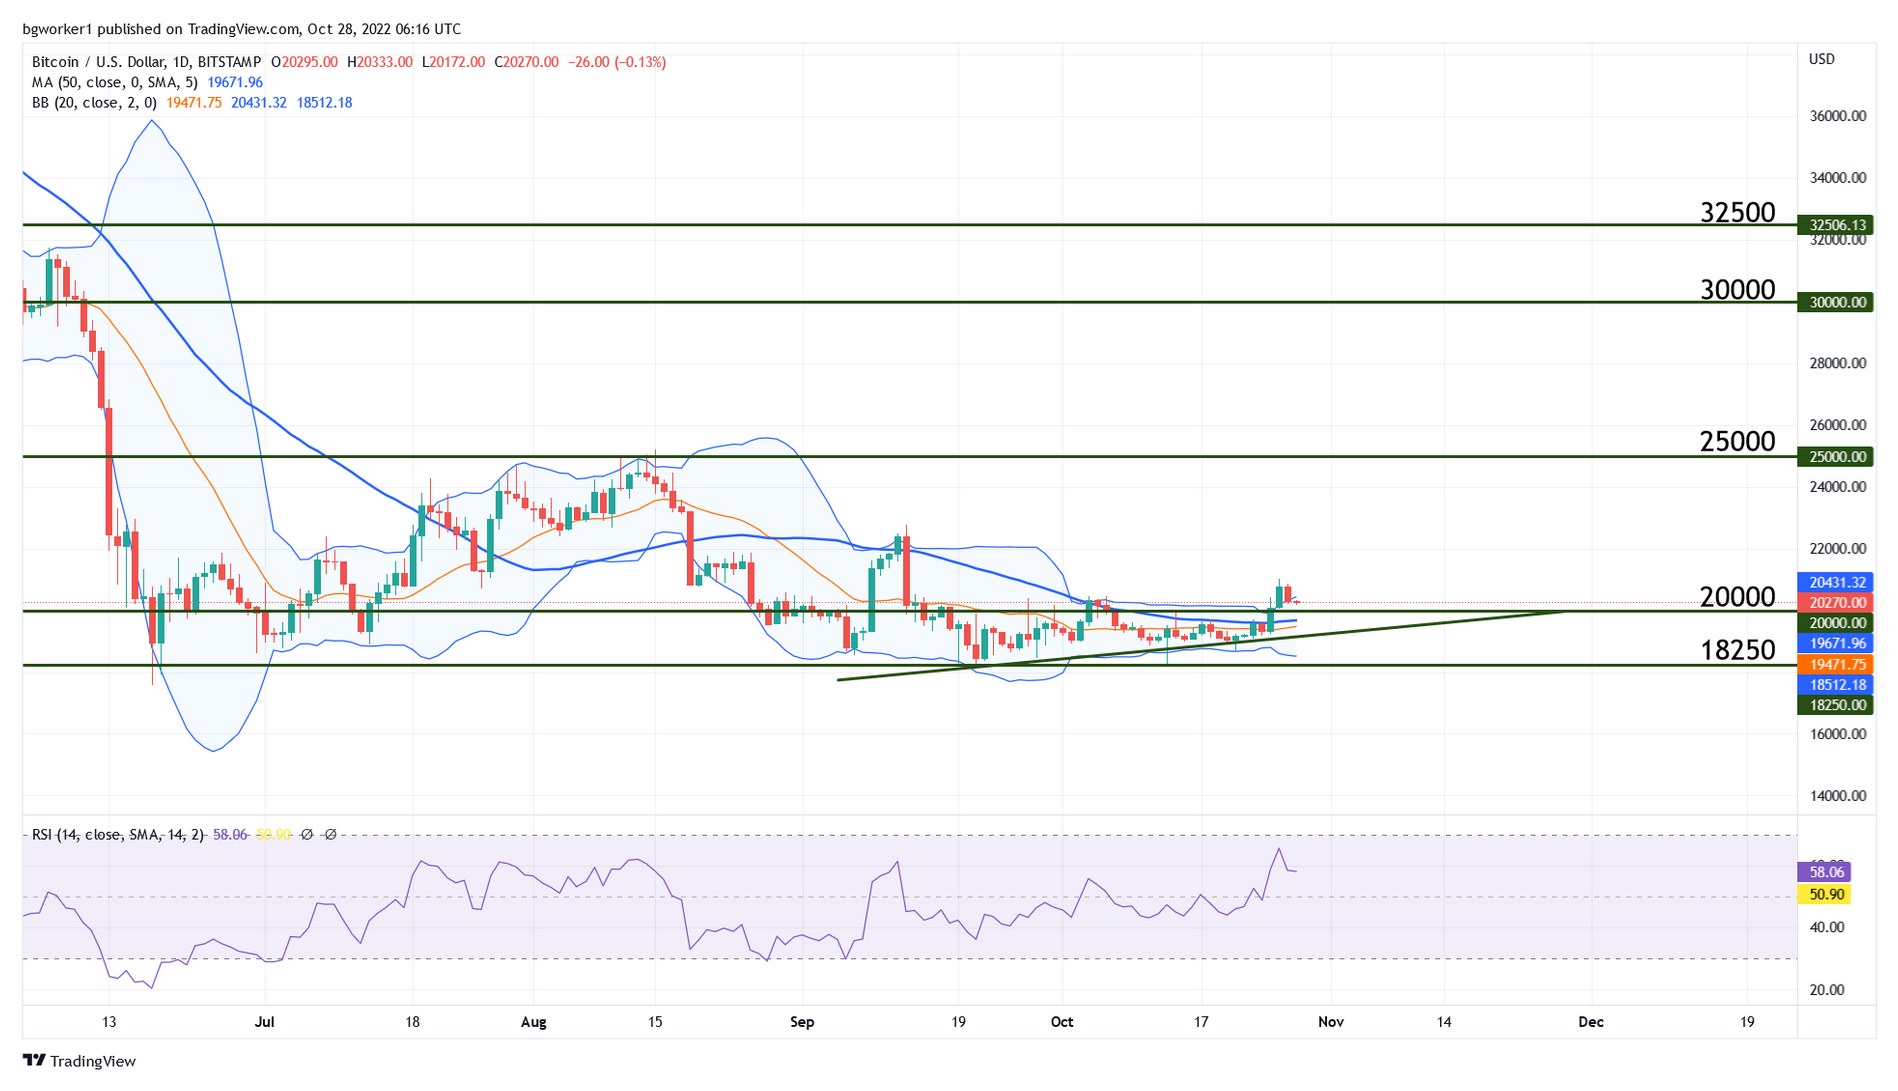
Moving on from the meme coin to the apex coin, Bitcoin has been showing bullish signs lately, following a period of sideways movement. On October 25 it managed to pierce the always-important $20K level and the next day, it continued higher, topping out at $21,012 before pulling back. At the time of writing, BTC/USD is trading at 20,110 and it looks like it is going to retest the key level at $20,000.
Technical Outlook – BTC/USD
In a recent post we talked about the fact that although U.S. inflation kept advancing, BTC/USD did not make a new low, which was an early sign that bullish action may follow. Right now the break of $20K is timid and we can see that the pair is returning for a retest of the recently broken resistance.
This retest is normal behavior and – if successful – it could turn $20K into support, which would be a major win for the bulls. In the case of a successful bullish bounce, Bitcoin is likely to push higher and the next point of interest will be the previous high at $22,780.
The development of the bullish scenario may be hindered by the upper Bollinger Band, which usually acts as resistance. However, the Bollinger Bands were tightly squeezed together before the recent rally and this type of action precedes a breakout. It remains to be seen if the bullish breakout was real or false; if the latter is true, expect a break of the bullish trend line seen on the chart below.