NFP Shock Sends Dollar Lower as CPI Takes Center Stage
EUR/USD tests a key resistance cluster, with a trend-line break potentially triggering further gains.
The US economy shed 23,000 jobs in July, according to the latest Non-Farm Payrolls (NFP) report, making a stronger case for the Fed to hold rates. Analysts had predicted that the US would add 85,000 jobs, so the surprise was that much bigger. Also, the previous report was revised to just 20,000 jobs, from the initial reading of 57,000.
After the release, the odds of a rate hike in September dropped substantially. Currently, the CME FedWatch tool shows a 44% probability of a 25-bps hike, down from 67% before the NFP came out. It’s pretty safe to assume that unless inflation moves drastically to the upside, the US interest rate will remain the same at the next FOMC meeting, in September.
Economic Calendar Highlights
This week we will have the chance to take a look at US inflation with the Release of the Consumer Price Index (CPI), scheduled for Wednesday at 12:30 pm GMT. The year-on-year Core CPI is expected to drop from 2.6% to 2.5%, but the forecast for the month-on-month version is 0.2% from the previous 0.0%. The Core version excludes food and energy from the calculation, and the Fed usually pays more attention to this version because it is less volatile.
The US Core Producer Price Index (PPI) will come out on Thursday at 12:30 pm GMT and is expected to show a 0.3% increase (previous: 0.2%). This indicator has inflationary implications because a higher producer price will eventually translate to a higher consumer price.
The economic week will end with the release of the US Retail Sales, scheduled for Friday at 12:30 pm GMT. The impact of this indicator is marked as medium, but sales made at retail levels represent the majority of consumer spending, which in turn accounts for the biggest part of the overall economic activity of a country.
Technical Outlook – EUR/USD
After two failed attempts to break 1.1400, the pair rallied, and the euro bulls are currently challenging the resistance at 1.1600. In fact, they are dealing with a cluster of resistance, formed by a bearish trend line drawn from the 2026 high at 1.2080, the 100-day Moving Average (yellow line on the chart), and the horizontal level at 1.1600.
The Relative Strength Index (RSI) is hovering near the top of its range, without being overbought. We may see a pullback when the RSI reaches overbought because the pair is in a range, although the latest move was strong and clear. RSI signals tend to be more accurate if the pair is not in a strong trend. A break of the bearish trend line could bring in additional buyers, but a lot will depend on the US data that’s scheduled for release this week.
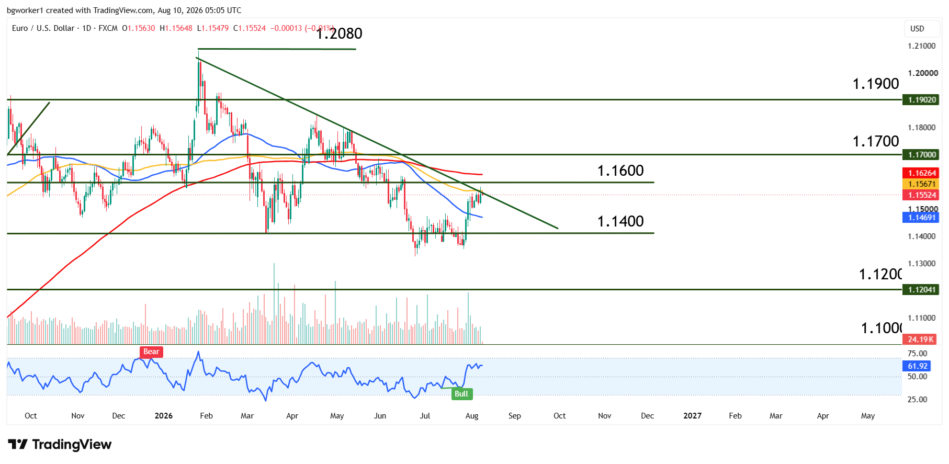
EUR/USD approaches the 1.1600 resistance cluster as the bearish trend line and 100-day moving average converge, setting up a key technical test ahead of US inflation data.