Bitcoin Has Finally Found Support! ETFs Are the Main Driver
Triple Top Shattered – BTC/USD Heads Higher as RSI Approaches Overbought
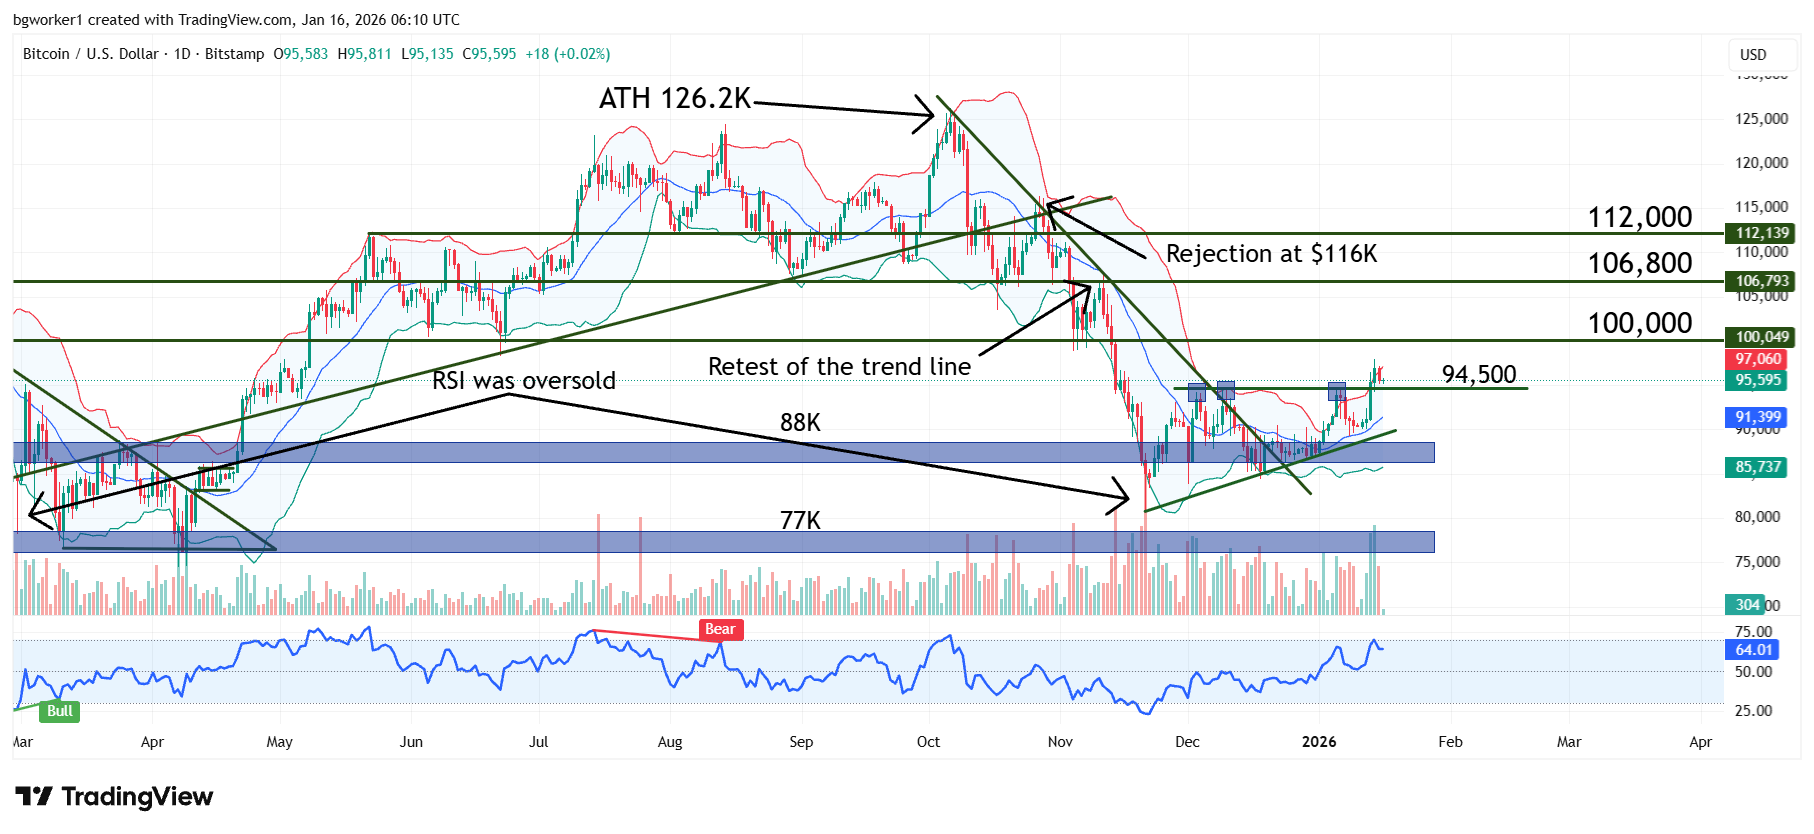
Bitcoin is finally showing technical signs of bottoming out, as well as increased demand and massive spot ETF inflows. The rally that started on the first day of 2026 hit a barrier at $94,500, formed a triple top, and bounced lower, making it look like the bullish move died out. But this week has been controlled by the bulls, and the major $94,500 resistance was broken.
A big role in this breakout was played by spot BTC ETFs and their massive inflows. On January 14, cumulative ETF inflows reached $840 million, according to Coinglass data. BlackRock’s IBIT fund brought in more than $648 million, followed by Fidelity’s FBTC with more than $125 million. A day prior, inflows totaled $753 million, with the same two ETFs in the lead; however, the places were switched, with FBTC in first place ($351 million) and IBIT in second place ($126 million).
The renewed interest in crypto ETFs seems to outweigh the fact that the crypto market structure bill is going through a rough patch. A markup was scheduled for yesterday, but the Senate Banking Committee delayed it after Coinbase withdrew its support for the legislation, and other frictions appeared.
Coinbase CEO Brian Armstrong said in an X post that “Coinbase unfortunately can’t support the bill as written”, citing a “de facto ban on tokenized equities”, DeFi prohibitions, and privacy concerns among other things. He added, “We’d rather have no bill than a bad bill. Hopefully, we can all get to a better draft.”
Chart Analysis – BTC/USD
Bitcoin is currently changing hands at $95,700 and is up more than 5% over the last 7 days. The key takeaway is that BTC finally broke above the resistance at $94,500, which capped its advances for a long time and rejected it lower three times since December.
The break of the triple top at $94,500 marks a key moment and opens the door for additional gains, with the most important being $100K. A break of the latter would confirm a bullish trend, but before the price gets there, the RSI will most likely enter overbought territory. In fact, even now, the RSI is touching its 70 level, which marks overbought.
At the moment, we are not dealing with an extreme condition, but the RSI could easily extend above the 70 level. Just keep in mind that the last time the RSI was overbought, Bitcoin was trading at its ATH, and we all know what happened afterwards.