Bitcoin Cools Off After Flirting With $36K. What’s Next?
Bitcoin Pullbacks: Profit Wells or Bull Traps?
After a stellar October, Bitcoin opened November with another push and came within a hair of $36K, at $35,968, marking a 17-month high. Last week we talked about the overbought position of the Relative Strength Index and a potential pullback. The pullback is happening right now but a harrowing question emerges: is it JUST a pullback?
Since the bounce at $25,000 that happened in mid-September, Bitcoin has been moving in a textbook uptrend, constantly printing higher highs and higher lows. With that in mind, this pullback from $36,000 is very normal, very welcomed, and very useful.
It’s normal because this is how trends work. It’s welcomed because it can clear the overbought status, allowing for additional gains in the near future. And it’s useful because it can offer a great entry point for bulls; and by great entry point I mean a lower price (hence more profits).
But trading would be almost risk-free if all pullbacks were followed by a higher high. Simply wait for a pullback, buy, and make a profit. But the current price action may easily turn into a bull trap for traders who bought the break of $35,000 (which is an important level). If that is the case, the current pullback may turn into a period of extended choppiness or a much deeper dive.
As a note, bull traps usually occur in bear markets, when the price temporarily jumps up, luring bulls into a long trade. In that regard, the current price action is not a “classic” bull trap but hey, if bulls are trapped in a losing trade, I guess we can call it a bull trap.
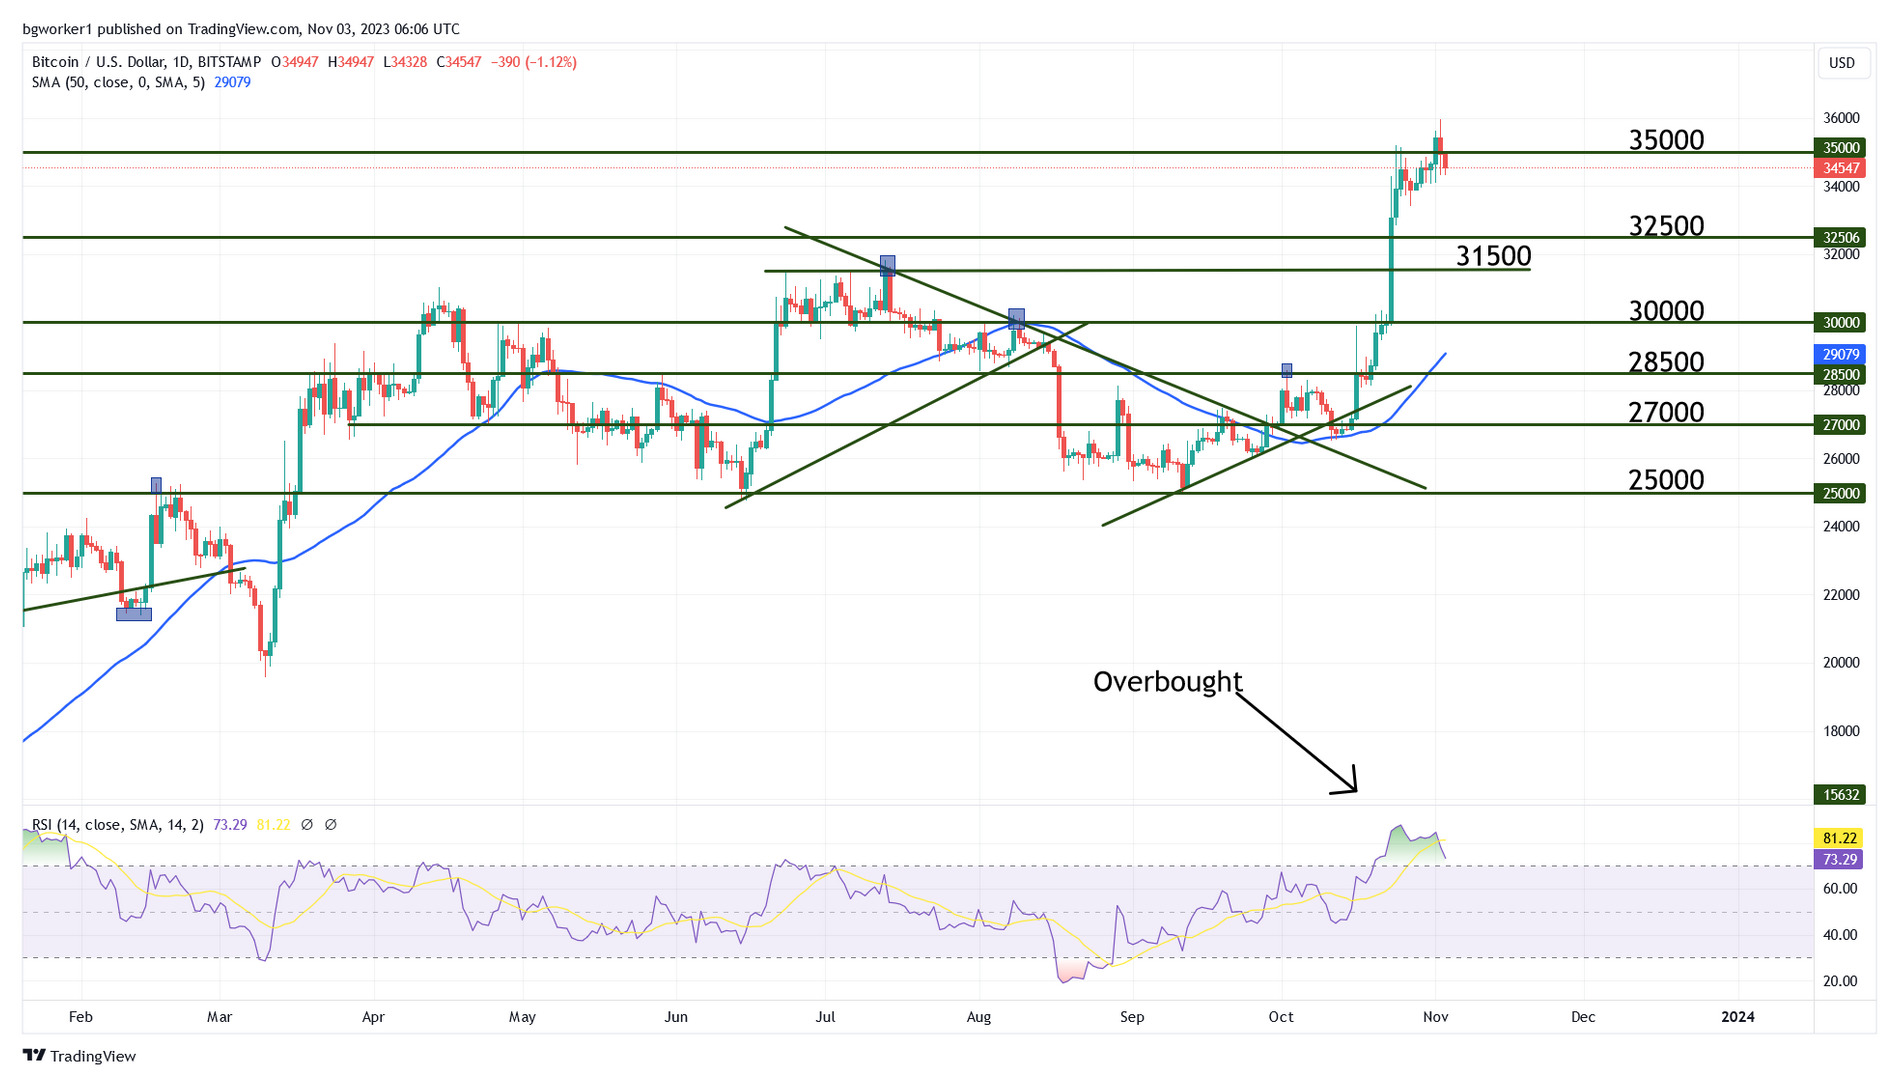
Chart Analysis – BTC/USD
After coming within inches of $36K, Bitcoin has retreated and is currently trading at $34,400. The daily candle that printed a new yearly high and came close to $36K shows a long upper wick and is red. This indicates that bearish momentum is growing and that the current pullback may extend into lower territory.
The RSI was clearly overbought even during the first encounter with $35,000, which occurred on October 24. The following move that pierced $35,000 and almost touched $36,000 created a higher high for the price but the RSI only printed a lower high. If you’ve read any of my posts, you already know what this is: regular bearish divergence. And you also know that it is one of the most powerful indications that the price will come down.
The questions now are: how low will the pullback extend, and will it be followed by a new high? To find an answer we will have to look closely at the price action around support levels such as $34,000 and $33,000. Keep in mind that any bounce should be confirmed by other factors such as volume and possible news (maybe about spot Bitcoin ETFs). Let’s not forget that today the NFP comes out, which could spark some movement on the US Dollar, and consequently on the BTC/USD pair.