Bitcoin Cash ABC, The Twice-Forked Coin
The first fork to Bitcoin had to do with it’s block size; the team failed to reach consensus and as a result, a hard fork occurred. This gave birth to the original Bitcoin Cash in August 2017. All users who held Bitcoin then had the same amount of Bitcoin Cash, instant free money.
But the fork-story doesn’t stop there. In November 2018 another hard fork occurred, this time with Bitcoin Cash as the “root”. It resulted in two coins with uncertain names as far as the masses were concerned: Bitcoin Cash ABC and Bitcoin Cash SV. Bitcoin Cash ABC is what we used to know as the original Bitcoin Cash.
The coins trade under the symbols BCHABC and BCHSV on some exchanges, while on CoinMarketCap and other exchanges you will find them under BCH (for Bitcoin Cash ABC) and BSV (for Bitcoin Cash SV).
BCHABC/USD Technical Analysis – The Big Picture
Bitcoin Cash ABC is commonly accepted as the “new” Bitcoin Cash and as evidence to that, it shares the same chart as the “old” Bitcoin Cash and the same symbol on CoinMarketCap: BCH. It trades at about $122 at the time of writing, with a market cap of $2,156,172,288 and occupies the 6th place in rankings by circulating supply value. Less than a month after the November 2018 split, BCHABC reached an all-time low of $81 and then set another new low shortly after.
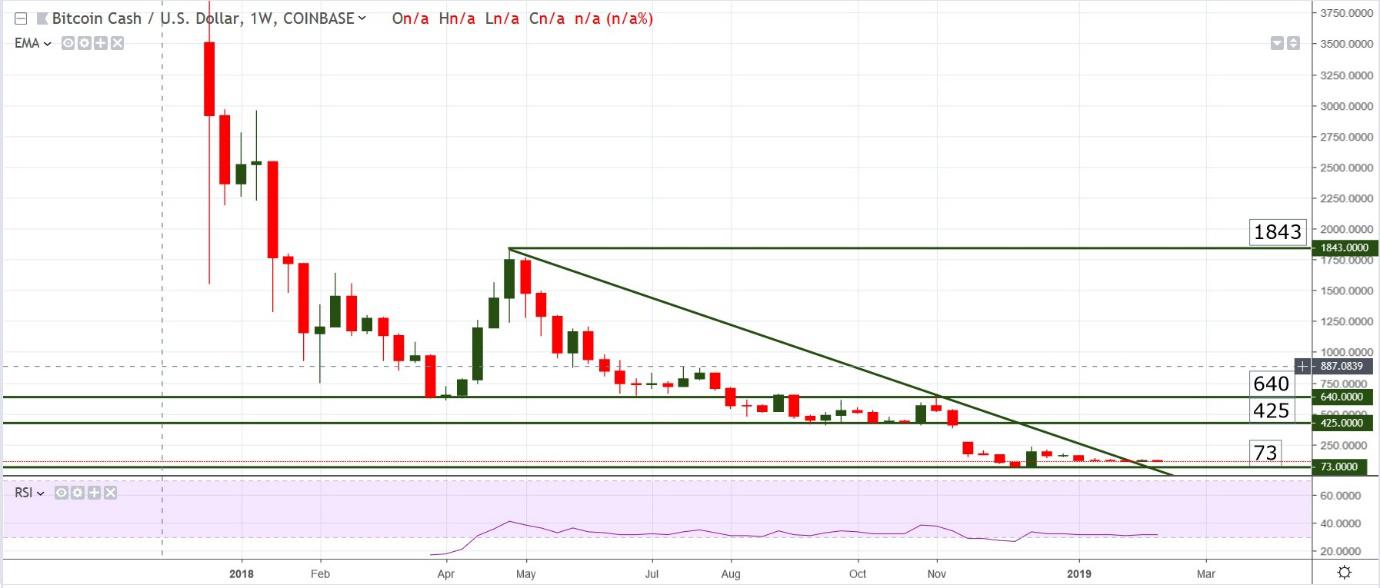
Since then it has shown nothing in the way of significant action and may continue to languish at these lows. The problem is that there are too many Bitcoins and this one sucks. Its not as good as BTC which is improved from the original, and its not as good as the Satoshi Vision which is what cryptocurrency is all about. There are no bullish signs on the chart and although price moved outside the bearish trend line, this cannot be seen as a break – price is simply drifting to the right with zero momentum.
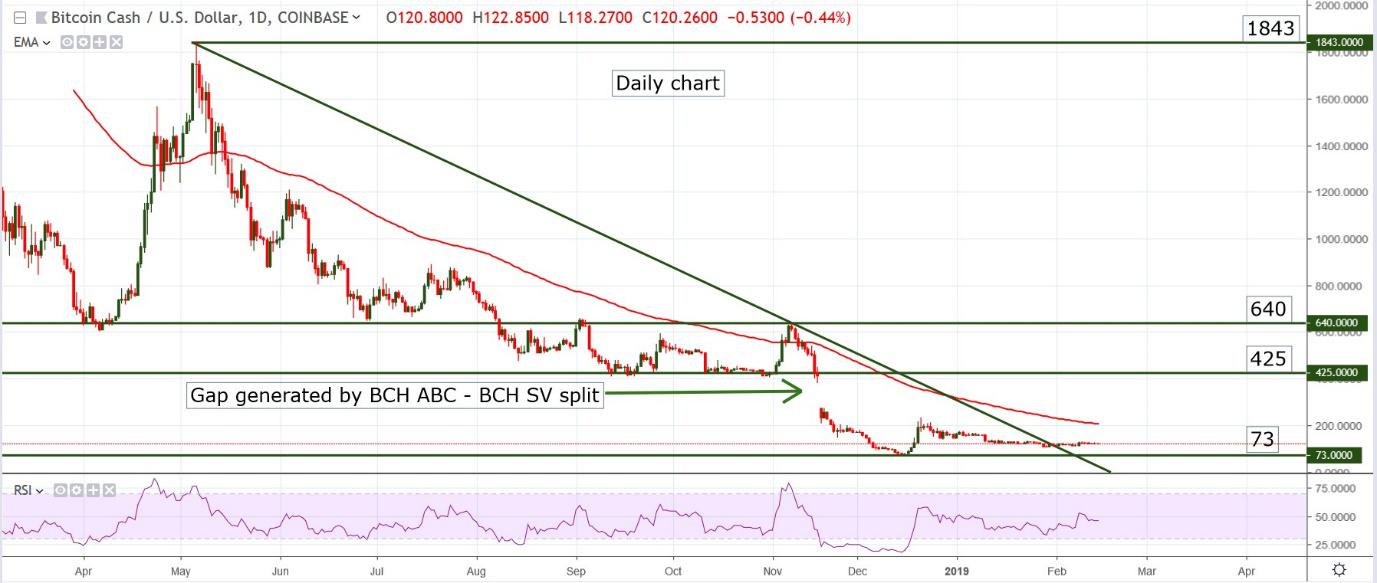
The Daily chart paints the same picture as the Weekly: it’s a lacklustre environment, with neither the bulls nor the bears willing to commit to a strong move, but we are in a downtrend overall so there’s potential for a new low over the next 3 to 6 months. This doesn’t mean that we won’t see any type of upside movement, but unless something drastic changes, the pair shouldn’t move above the gap created at the time of the split.
Daily Chart Support: $73
Weekly Chart Support: $73
Daily Chart Resistance: $230 and the 100 days EMA (red)
Weekly Chart Resistance: $400 – $425 as well as all big round numbers on the way up
Most likely scenario: continuation of the downtrend, printing of a new low in the months to come; minor upswings possible
Alternate scenario: given the flat movement, breakouts could occur to either side; caution is advisedc