Bitcoin Breaks Out, New Highs Are Now On Tap
The Crypto King Breaks Through. Is the Rocket Fueling Up Again?
by Bogdan Giulvezan
Bitcoin made history again! On March 13, it hit another milestone by posting a new All-Time High (ATH) at $61,618 according to CoinMarketCap data. The previous ATH was located just above $58,300 and was made on February 21, 2021.
However, the last time that Bitcoin broke the high, it exploded and added almost $15K to its price, but this time it just surpassed the previous peak by about $3K and then started to correct lower, now trading in close vicinity to $58,000, after a brief visit below $55,000. Could this be a warning sign that Bitcoin is starting to lose its oomph, or just a normal pullback in an uptrend? Recent price action still falls under the rules of a textbook uptrend, thus there’s no need to worry, at least as long as Bitcoin is making higher highs and higher lows.
Some of the altcoins have yet to surpass their ATHs, as we saw Binance Coin (BNB) hit $320 more than a week back and trading in a relatively tight range since then. On the other hand, Ethereum came just shy of its $2,000 ATH, reaching north of $1,940 on March 13 but correcting slightly lower since then. Cardano (ADA) came very close to its previous ATH ($1.47) and hit $1.46 twice on March 18, but failed to push through and is now trading around $1.28.
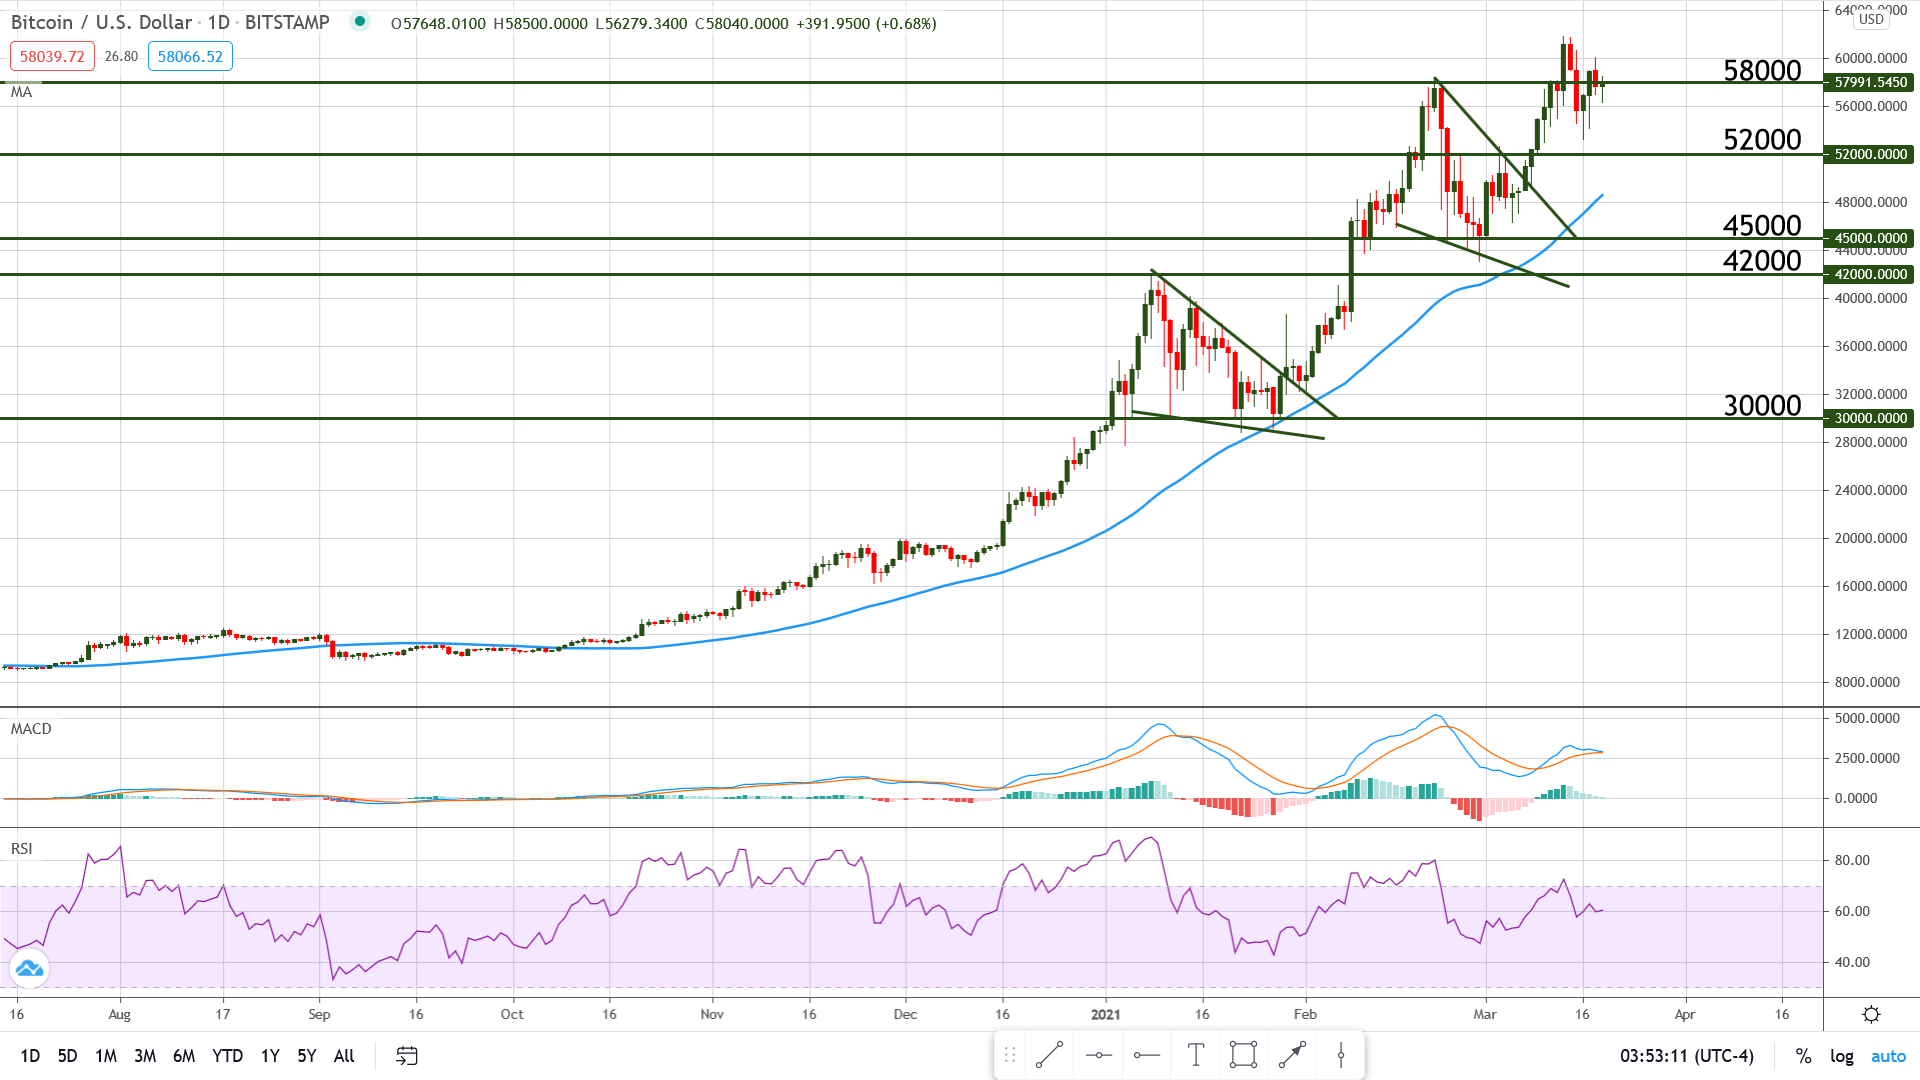
Chart Analysis – BTC/USD
Now trading at $58,360, Bitcoin has recovered from a correction that took it as low as $53,200, but it is worth noting that the current level is an important S/R, especially because it was the previous peak. The fact that price started to correct lower soon after the initial break of this level, confirms its importance, but it’s nothing out of the ordinary because it’s quite common for price to come back to a level that was recently broken.
The fact that we are dealing with a “normal” uptrend is further supported by the bearish divergence that I’ve mentioned in my previous analysis: price was making a double top at the time, while the Relative Strength Index was just printing a lower high, which was indicative of a future correction. In the meantime, that correction occurred and now price seems to prepare for another push into $60,000 territory.
A key factor for short-term price action is the current S/R level located around $58,000 because a break would open the door for a move into the recent ATH at $61,618. The chart shows a few bullish candles with long wicks, which are indicative of bullish pressure but on the other hand, the MACD lines are close together, indicating that bullish momentum is thinning. Although the picture is somewhat mixed, a daily close above $58,000 will probably spark additional buying interest.