Bitcoin and Ethereum Hold Their Ground Despite Pullbacks
Binance Coin (BNB) Outperforms All Major Cryptos.
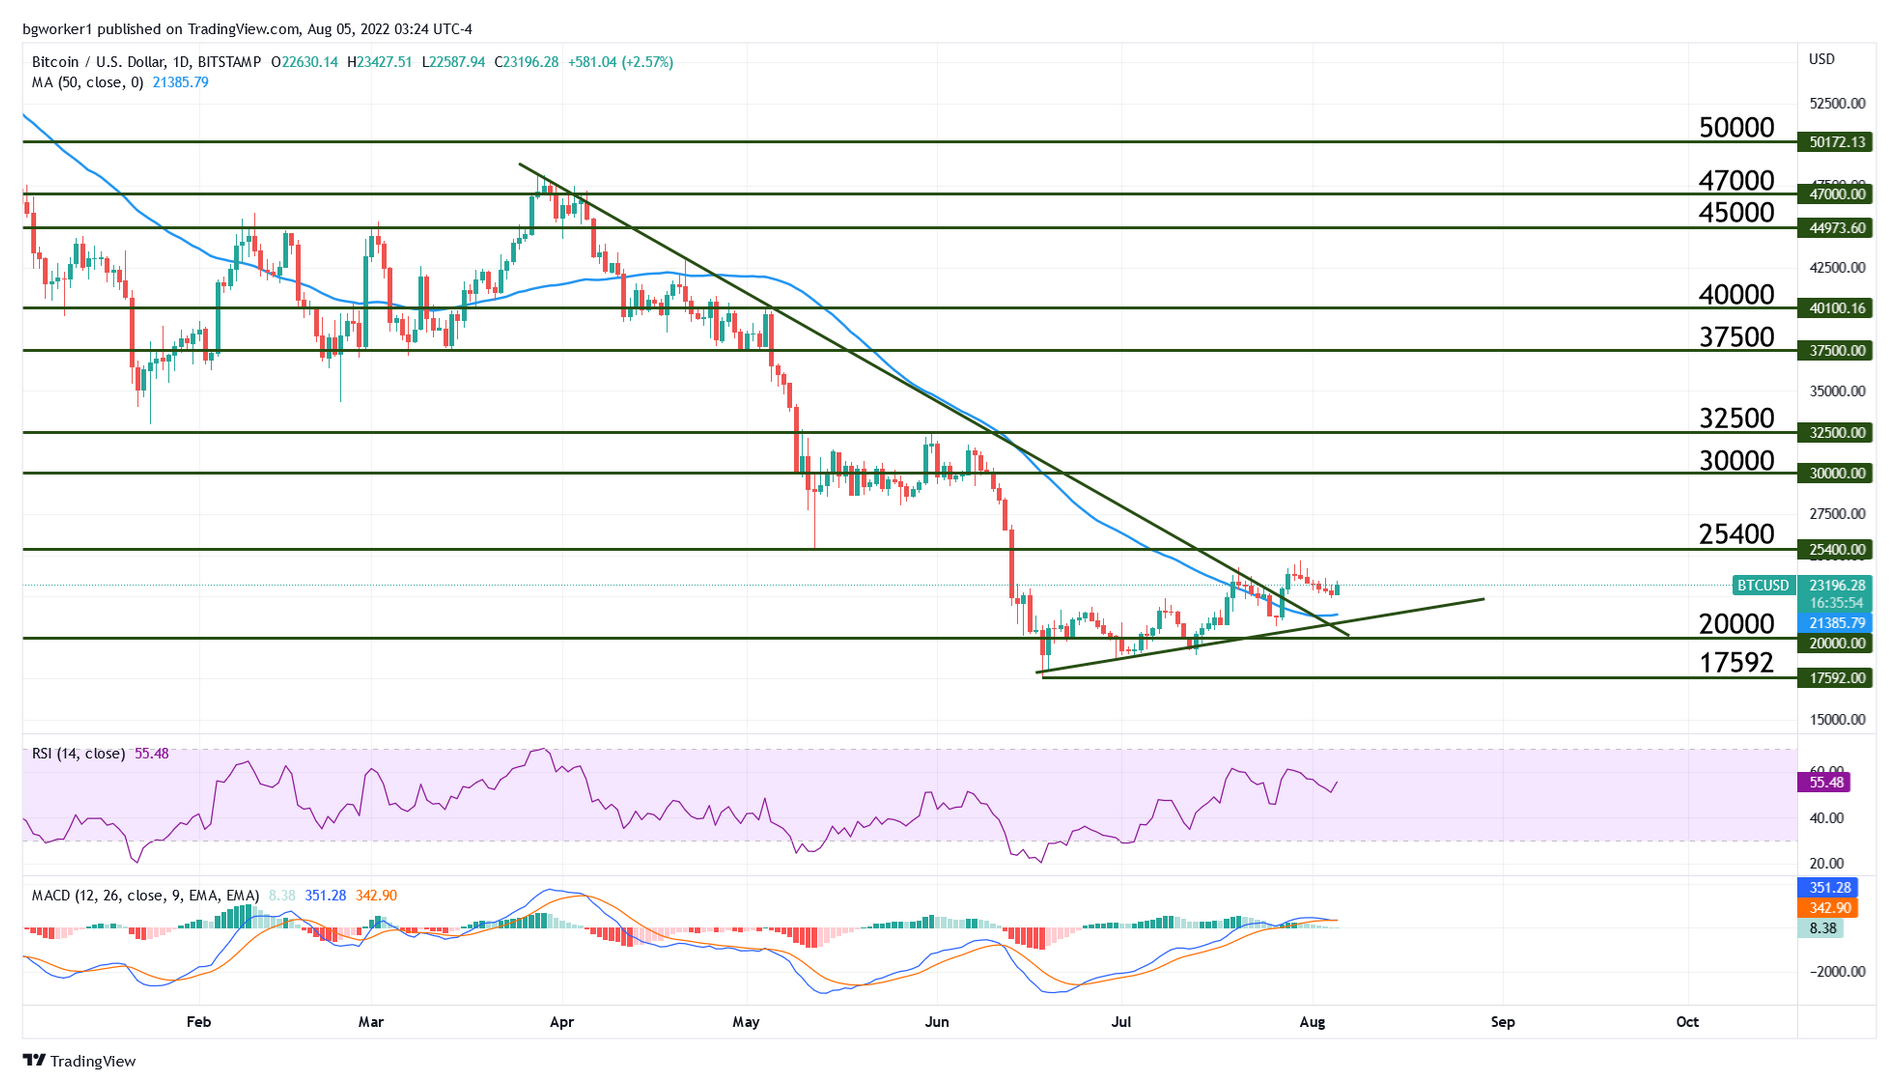
In late July, Bitcoin managed to move above a bearish trend line printed from the March 2021 top but it failed to make significant advances after the break. Although BTC/USD is still trading above the said trend line, the pair started a slow and grinding pullback that took it from a recent high at $24,676 to $23,180 (price at the time of writing).
Ethereum also posted gains but gave some of them away in recent days. What we can take away from the price action of the two biggest coins is that currently, the bulls are showing more strength than the bears. This is evidenced of course by the fact that the price is moving higher (since the $17,592 low) but also by another detail: the recent red candles have very small bodies and long wicks, while the green candles are fuller and longer (big bodies, small wicks).
Meanwhile, Binance Coin (BNB) is disregarding what its big brothers are doing and it can’t be bothered by any pullbacks. It is up almost 15% over the last 7 days and just over 5.0% in the last 24 hours alone, currently trading at $317. However, it has entered overbought territory on a Daily chart and if history repeats itself, we will likely see a bearish move in the near future.
In other news, Solana’s most popular wallets have been targeted by hackers who allegedly stole around $8 million in total. The compromised wallets are Slope, TrustWallet, Solflare, and Phantom. Solana (SOL) pointed the finger at Slope, saying that the security issue is related to their wallet, not Solana’s blockchain.
According to researchers from crypto security firm Otter, Slope wallet sent users’ seed phrases to a centralized server and kept them in plain text form. If this is indeed true, it’s a major security flaw and it shows utter disregard for the safety of the users’ funds. Despite the hack, SOL’s price is up almost 3.0% for the last 24 hours and it doesn’t seem to be severely affected.
Chart Analysis – BTC/USD
The break of the long-term trend line and the 50-day Moving Average puts Bitcoin in a good spot, with the potential for additional gains. The previous top at $24,676 is a possible target and if bullish pressure increases, we may even see a test of the resistance at $25,000 – $25,400.
If the current pullback continues, the pair is likely to find support at the 50-day Moving Average and the bullish trend line seen on the chart below. The MACD lines are close together, showing that bullish momentum is diminishing; however, this is normal during a pullback.
As long as the pair is trading above the bullish trend line and the 50-day MA, the short-term bias is bullish. However, let’s not forget that BTC is in a downtrend since November 2021, thus sudden drops are not out of the question.