Bitcoin $65,000 Here We Come
Double Top – The Omen of a New All-Time High?
Bitcoin is currently printing a double top pattern just above $58,000. The previous high was posted on the 21st of February, just north of $58,300, and yesterday the “digital gold” hit $58,155, according to TradingView charts. Since then, Bitcoin has retraced slightly, currently hovering around $56,600.
March has been a great month for Bitcoin thus far, as the coin only showed two bearish daily candles, which were quickly nullified by bullish gains. Last week we’ve talked about a wedge formation and how price could make significant advances as soon as it exits the wedge. That scenario materialized but we have one more obstacle: the previous high. If the bulls manage to surpass the said high, price is likely to shoot past $60,000 in a relatively short while.
Of course, we must keep in mind that a double top is inherently a bearish pattern, but on the other hand, if price moves above $58,300, there’s no double top anymore. Considering how strong price moved after it exited the wedge formation, a break of the current resistance is not farfetched.
March has been a good month for other cryptocurrencies as well, with Ethereum up more than 22% in the last 7 days (currently trading close to $1,800), Binance Coin (BNB) up more than 30% (trading near $290 at the time of writing) and Litecoin up more than 23% (currently trading at $211). Most of the mentioned digital assets are approaching their previous peaks, thus it’s likely they will at least print a double top in the near-term.
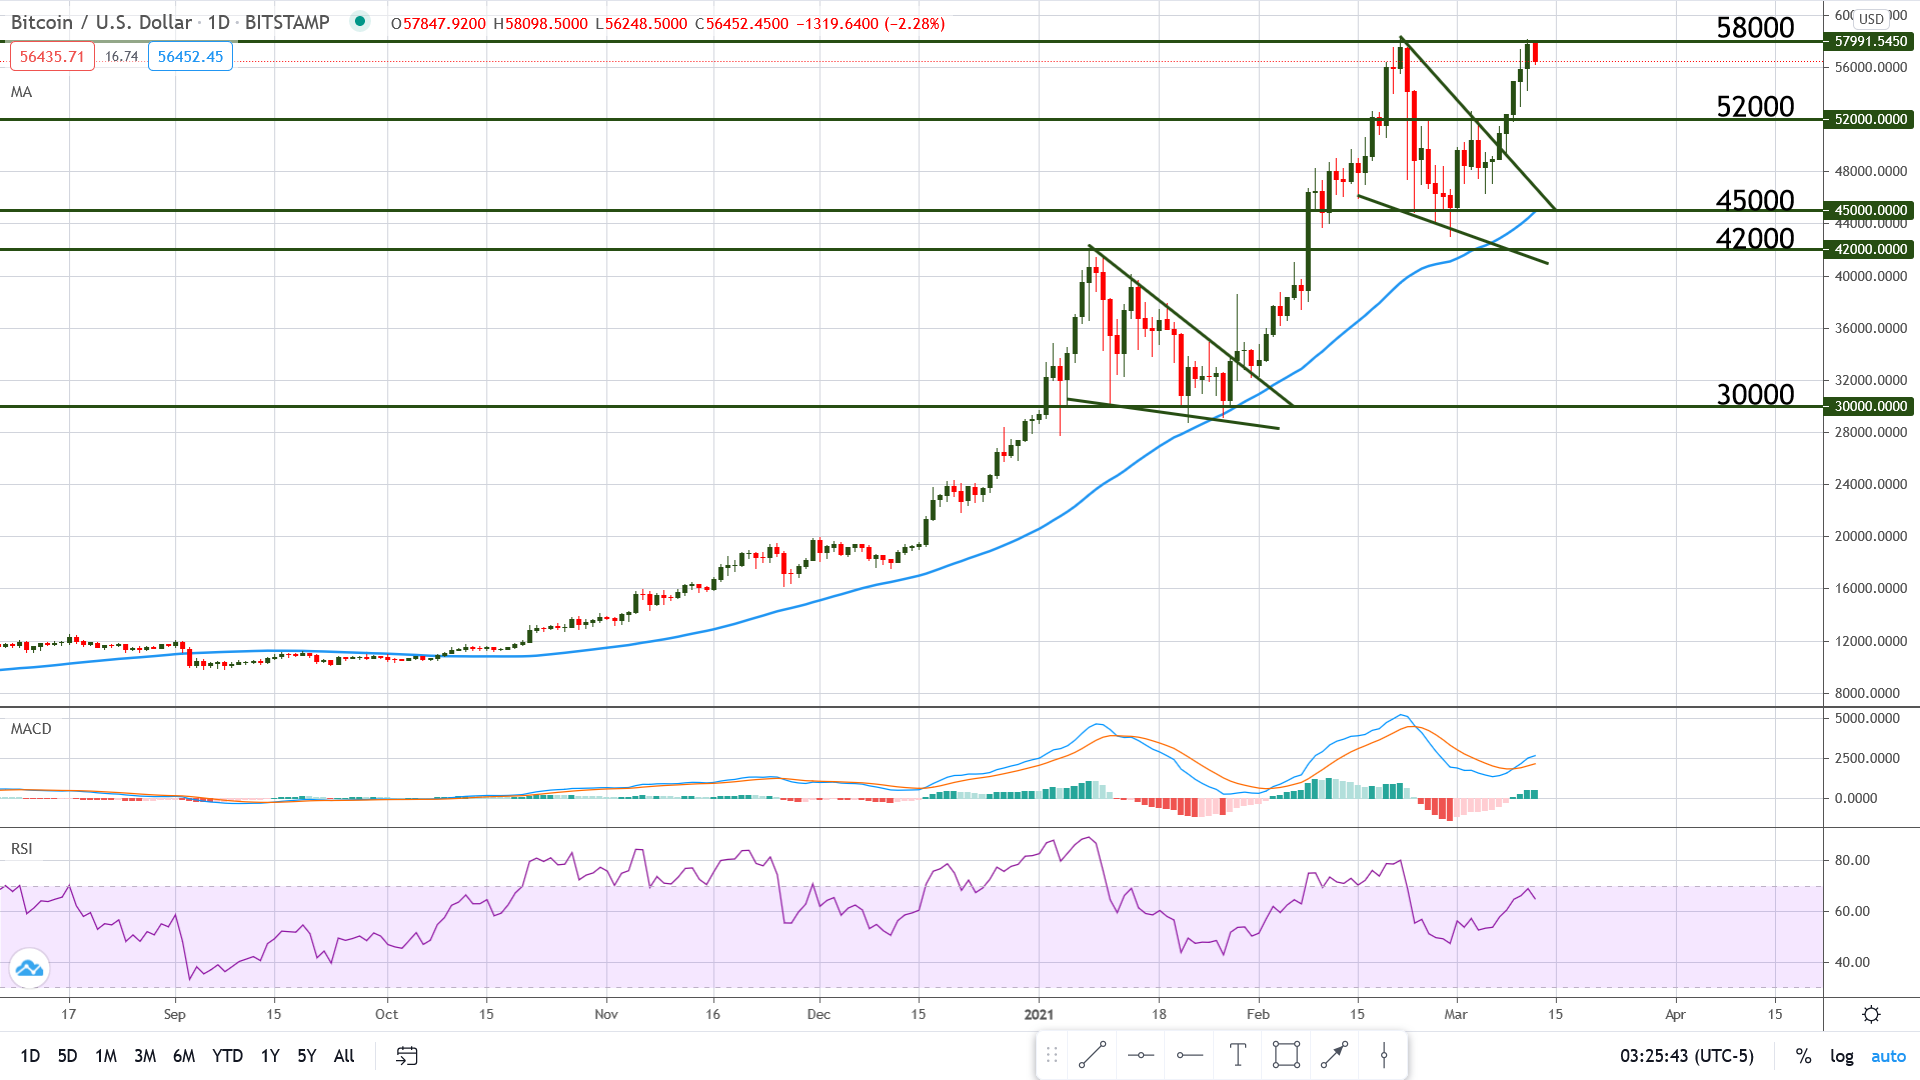
Chart Analysis – BTC/USD
Bitcoin added more than 20% during the last 7 days and in the process, it broke above the bearish trend line that’s part of the wedge pattern seen on the Daily chart below. We are now dealing with a “bounce or break” scenario and the double top formed at $58,000 is the star of the show.
The technical indicators are showing conflicting information, which calls for caution: the MACD has just crossed bullish, which indicates strong upwards momentum, but on the other hand, the Relative Strength Index (RSI) is moving south and is showing bearish divergence. This type of divergence happens when price is printing a higher high (or even a double top) but the oscillator is only showing a lower high.
Depending on the outcome of the current “battle”, we are looking at $60,000 as the immediate target, followed by $65,000, in case of a break. If price bounces at the current resistance, it may find support at $55,000 followed by $52,000 and possibly $50,000 as psychological support.