Trades for January 9 and 10, 2014
During the latter two days of this week I looked at the markets for over twelve hours and found a grand total of zero trades to take.
Thursday
Thursday provided some potential areas that could have possibly been worthy of trading. The pivot point and support 1 level came into play multiple times in addition to some price congestion. So the potential for trades was definitely there. But this was just one of those days where nothing cleanly set up according to my personal preferences. Therefore I didn’t trade. As I mentioned in one of my previous blog posts, overtrading is a big reason why many traders can never manage to be profitable. According to my basic strategy, taking just one trade in this market would have been a case of overtrading. When nothing sets up, I simply sit on my hands and wait.
In the screenshot below, I’ve labeled four different areas where trades could have set up, but did not for various reasons. I will describe the circumstances surrounding each area individually.
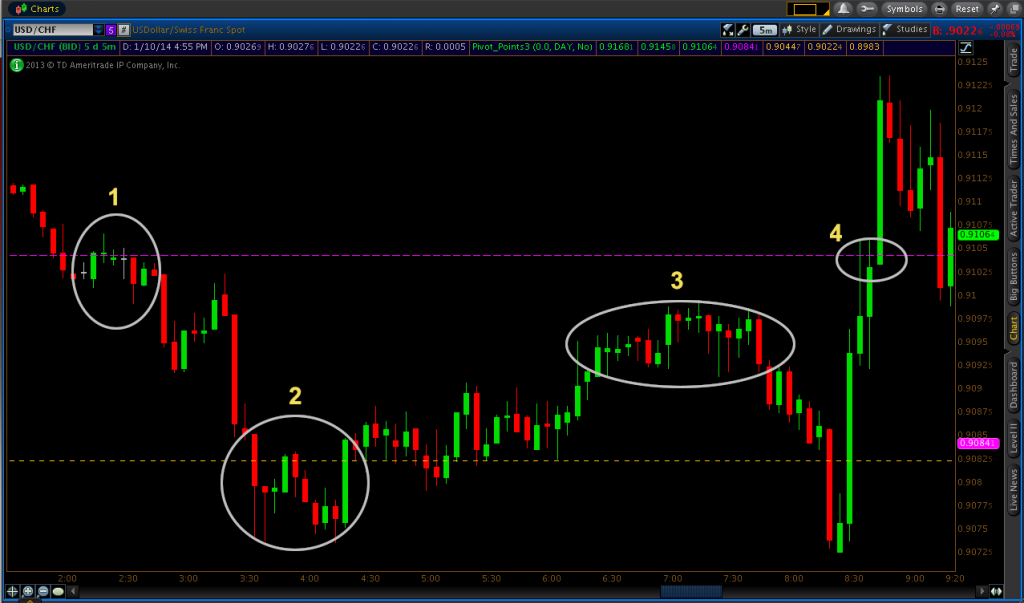
Area 1: Here we saw congestion around the daily pivot level of 0.91042. Given that the pivot had been broken downward already, one might expect that level to hold as resistance. Ultimately this was indeed what would happen. But the reason why I had no interest in this trade was due to the minor support level that had formed just beneath the pivot. If one were to get into a put option by entering in at the pivot, one could encounter support less than three pips below the trade’s entry. I prefer to have at least five pips of breathing room on a 5-15 minute trade and preferrably much more. As a result, I gladly passed on this trade.
Area 2: This potential trading area was entirely centered around the support 1 level (yellow dashed line on the chart) of 0.90823. I was watching this area closely for a potential reversal, but price blew right through it on its first test. If price would make a reasonable move down below support 1 to legitimately suggest that more downward movement could occur, then support 1 could be reasonably viewed as an area of resistance to consider for put options in more of a trend-following move. But with the breach of support 1, it basically invalidated the area as a support level for call options.
Area 3: Area 3 outlines price congestion in the market. In the past I have taken trades where price was rising, then stalled with upper wicks forming on consecutive five-minute candles. This suggests that buyers are losing their influence, which could be an indication that the sellers are likely to drive the market back down very soon.
In this case, volume in the market was relatively low and the thin range of the price congestion compounded by the recent uptrend suggested to me that considering put options in this area was too risky.
Area 4: Leading up to the re-touch of the pivot level (denoted by area 4 on the chart), price broke back down below support 1, before it was time for U.S. jobless claims data to come out (paying attention to the news and planned news releases is always important).
Jobless claims are released every Thursday at 8:30AM EST. The figure does seem to be paid attention to a bit more before the release of U.S. jobs data the next day as more of a forecasting metric, if anything. The U.S. jobs data/non-farm payroll (NFP), of course, is a once-a-month occurrence always released on a Friday (usually the first of the month) at 8:30AM EST. The jobless claims released figure was 330,000, a drop of 15,000 from the previous week, which provided evidence of a stronger U.S. labor market. This is obviously good news for the U.S. economy and its currency, the USD. Because of this, price shot up quickly, showing no sensitivity to support 1 and quickly coming back up to the daily pivot.
In many cases, when price rejects a pivot point strongly and comes back up and rejects it again, this might be an indication that it’s time for me to get into a trade. My trading fundamentally revolves around that concept. Nevertheless, you need to always use proper discretion in these circumstances otherwise you’re going to needlessly fall into what are actually low-probability trades that will often lose. After such a relatively significant news release, technical factors on the chart don’t matter as much. Even with multiple rejections of the pivot, the volume in the market at this point is huge and anything can happen. Technical cues get thrown out the window and you’re much better off staying on the sideline until the market cools off a bit. Therefore, no trade was taken here and I decided to stop trading for the day.
Friday
Friday’s lack of activity was somewhat understandable, as the market was lazy heading into the release of the non-farm payroll data at 8:30AM EST. It may often be the case that no strong support and resistance levels form from the price data. As a result, no trades are taken according to my strategy. The best bet is to have a pivot point level come into play, which usually does a pretty good job of holding heading into the release of the U.S. jobs report given the volume in the market is low as everybody is waiting around until the release of that data.
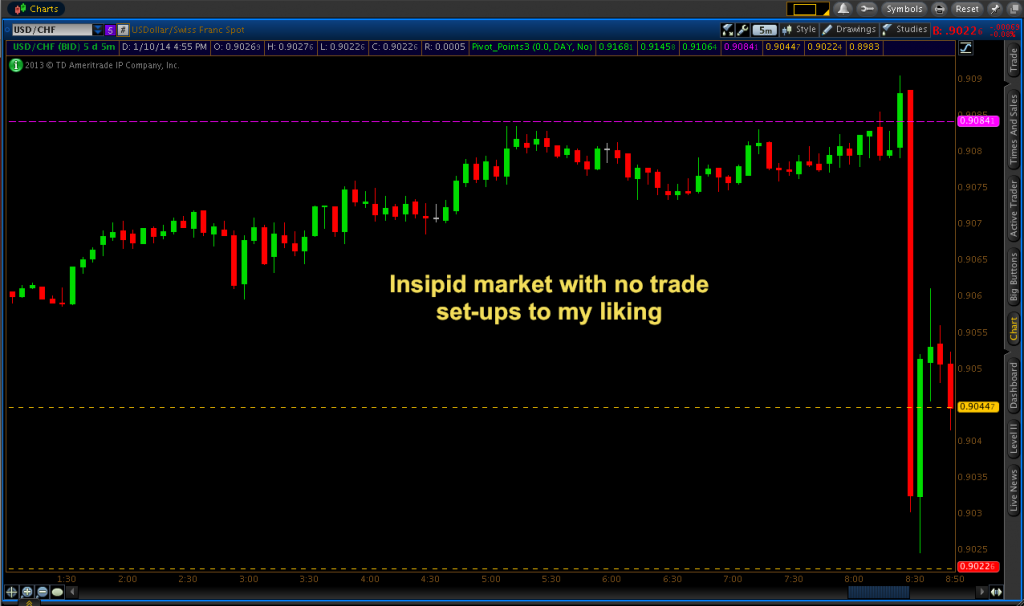
As you can see from the above screenshot, the USD was steadily trickling upwards throughout the morning without actually setting up any quality trades along price levels that the market was sensitive to. Market volume was so light that a new high and low was established on the same price bar once the data was released.
Simply put, no trades were worth getting into on the USD/CHF during these two days according to the way I like to trade. Forcing trades is never a good idea, so I was very happy to keep my account balance situated right where it was.