An ETF that Foreshadows Gold Price Movements
Interested in trading gold? Then you’ll probably want to know about this ETF that usually turns just ahead of gold prices. That means if you are thinking about going short in gold, you can wait for the ETF to turn lower, which means gold prices should follow shortly after. If you want to go long gold, wait for the ETF to turn higher and gold should move higher shortly after.
The ETF
An ETF is an exchange traded fund. It is like a mutual fund but trades on a stock exchange like a regular stock. The Market Vectors Gold Miners ETF (ARCA:GDX) is an ETF that owns stocks in a bunch of different gold miners. The stocks of gold miners have a tendency to react a bit before gold.
The phenomenon is most noticeable on a daily chart, and helps pick turning points in gold. On intra-day charts this also occurs, but the signal isn’t as reliable because sometimes gold will lead GDX and other times GDX will lead gold.
Figure 1 shows several instances where GDX peaked or bottomed before gold. The chart is a daily chart of The SPDR Gold Trust (ARCA:GLD), another ETF (actually a “trust” in this case) which tracks the price of gold because it holds gold in trust.
GDX is overlain on the chart in yellow so gold (or a proxy for it) and GDX can be seen side-by-side.
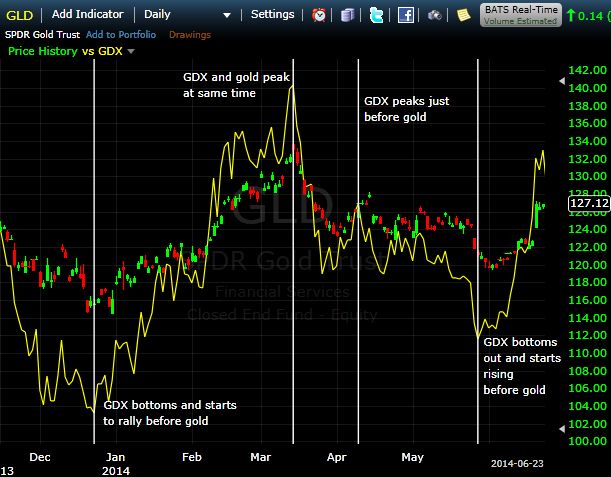
The chart shows that GDX has a tendency to peak or bottom out a few days before gold.
This is only useful though when some other form of analysis involved. This is because it is only in hindsight that we see when major bottoms and peaks occurred. In real-time we don’t know if a bottom or top in GDX is going to result a just a small reversal or a big reversal.
Trading the Relationship
Trend analysis can aid in this regard. Assume the trend is down in gold, as it was during 2013. The trend gives us the direction to trade in and therefore the GDX “indicator” is more useful.
During a downtrend in gold, wait for a pullback to the upside. Once GDX stops rising, and begins to fall again, you can look to initiate the short position. “Begins to fall again” needs to be defined though. In the chart below I have drawn small trendlines to mark points that if GDX drops below, GDX (and gold) is likely to continue dropping.
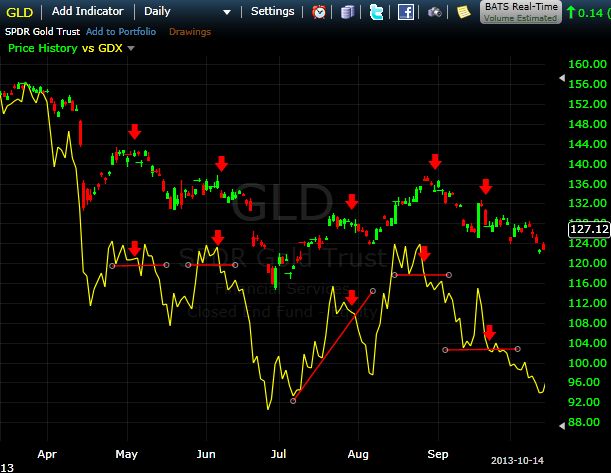
In figure 2 above we see several pullbacks higher within an overall downtrend. During those pullbacks we let the price pause so we get very small support areas. When the price breaks through those support areas in GDX it indicates GDX is going to continue dropping. This would also be the time to take a short position in gold, because gold is likely to follow suit and move lower a couple days after GDX.
Final Word
Using a gold miner ETF such as GDX to help trade gold is a method that can be used when there is a strong directional bias in both the ETF and gold. While GDX may provide a slight foreshadowing of what is likely to happen with gold prices, traders need to remain adaptable. In real-time we don’t know if a peak or bottom will be a major one or not; this is why we use a trend and trade in the trending direction. GDX simply helps with timing trades in the gold market.
Like any method, being able to perform this type of analysis, and ultimately being able to trade off of it, takes practice. Try your hand at it in a demo account before utilizing real money.
Cory Mitchell, CMT – https://twitter.com/corymitc