ADA Hard Fork Ahead – Buy the Rumor, Sell the News?
The Crypto Market Is in Shambles, Yet One Coin Is Getting Ready to Burst
Since the $3.16 All-Time High reached in September 2021, Cardano (ADA) has been sliding lower, depicting a textbook downtrend. Despite the sustained drop, people are already talking about a new All-Time High. Bear in mind that currently, ADA is trading at $0.62 and it is still miles away from the $3.0 mark. So, what is sparking this new wave of speculation? The Vasil hard fork!
Scheduled to go live on June 29, the Vasil fork is expected to improve the sustainability and scalability of the network and usher in a new wave of DApps. According to Cardano’s founder, Charles Hoskinson, there’s a plethora of DApps just waiting for the hard fork. He Tweeted: “What most also don’t understand is that many Cardano DApps are waiting for the Vasil hard fork in June to launch to benefit from pipelining”.
Historically, ADA’s price reacted positively to major upgrades of the network and optimism is sky-high for the Vasil fork as well. ADA supporters are anticipating a move above $1.0 and many are buying the rumor. As a matter of fact, ADA has been bullish since the end of last month and it is currently testing a major resistance zone, which if broken, could spark additional gains.
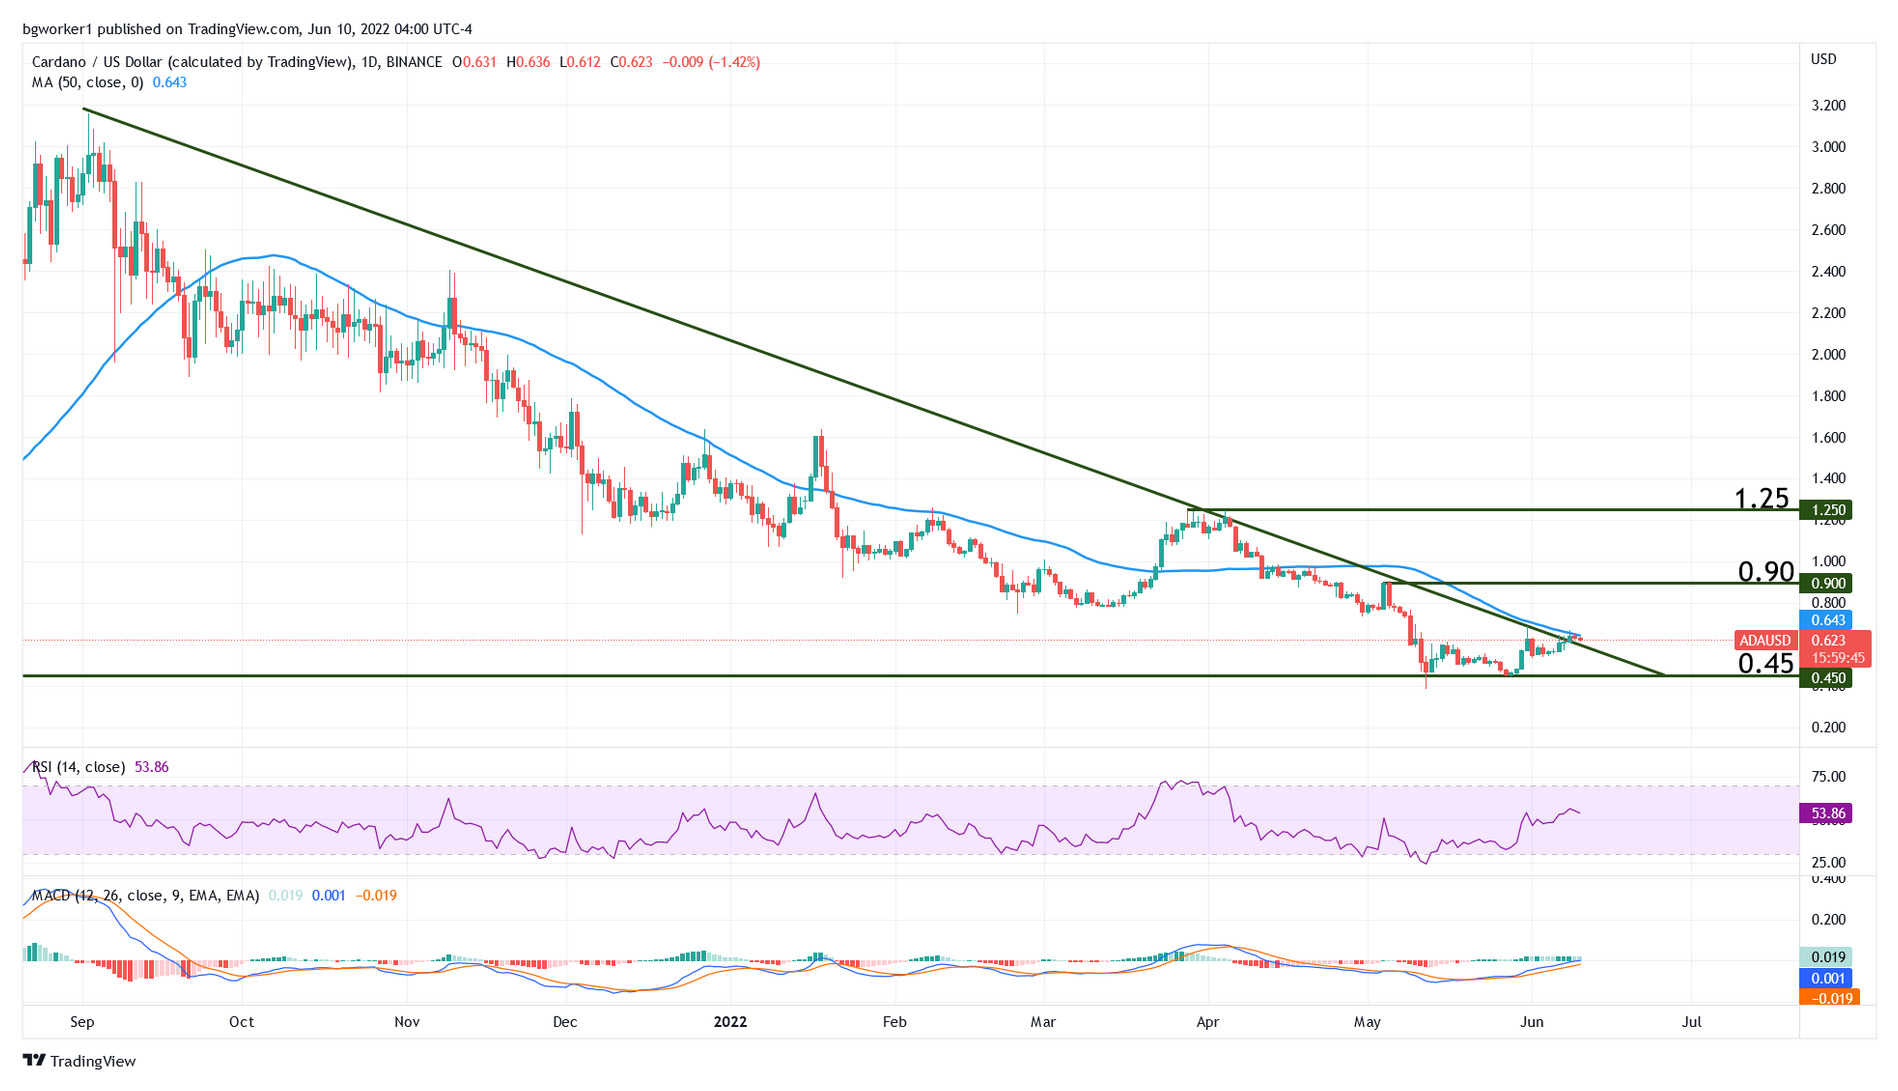
Chart Analysis – ADA/USD
The pair is currently trading at $0.62 and has a bullish bias despite being in a long-term downtrend that started in early-September 2021, immediately after the All-Time High at $3.16 was reached.
The optimism surrounding Cardano may propel its price above the 50-day Moving Average and above the bearish trend line which capped the price since the September high. If the bulls manage to break this important resistance zone, the chances of the pair reaching $1.0 will increase drastically.
Before ADA can reach the major level at $1.0, it still has to break the minor resistance at $0.90 (early-May high). However, it must be noted that the Relative Strength Index is already showing bearish divergence: the price is making lower highs and the RSI is making higher highs.
This is called hidden bearish divergence and appears in a downtrend. The signal is stronger because it is in line with the prevailing trend. What this means is that a failed break of the trend line and the 50 MA will likely result in a sharp drop towards $0.45.