A Look At Moving Averages For Binary Options
Moving averages are one of the most basic and least talked about technical indicators I know. It seems surprising, nearly every strategy article or analysis will include some mention of a moving average but few actually talk about them. Binary options traders should find them especially useful; moving averages can provide reliable directional entry signals in multiple time frames, can do this on a single chart and are great coincident indicators. Why does this matter to binary traders? Binary options are all about directional movement, will an asset be higher or lower than it is now? Moving averages track the movement of an asset and provide the first clues as to where price may be heading next.
What is a moving average and why does it move? The most basic definition is that a moving average is a line plotted using the average price of an asset over a set period of time. For example a 30 bar simple moving average is a line created by plotting the price of an asset over the past 30 bars or trading sessions. If you are using a chart of daily prices then it is a 30 day moving average, if you are using a 15 minute chart then it is an average of the past 30 15 minute bars. Each period as a new closing price is added to the data list another is dropped off the end. In this way the average “moves” along with the asset and provides the name of the tool.
How Do You Use A Moving Average
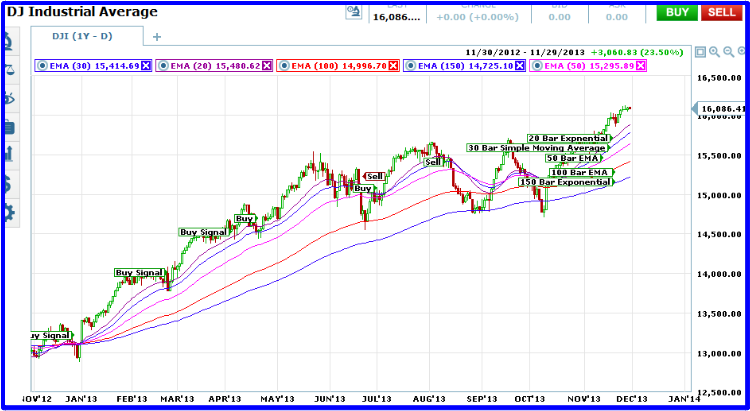
Moving averages a can be set to different time frames. Different time frames mean different signals. In order to do this simply change the number of bars used to calculate the moving average. This is usually a simple change on most platforms. Popular moving averages are 9 bar, 15 bar, 30 bar, 150 bar and 200 bar. The chart below illustrates a daily chart of the Dow Jones Average with 30 and 150 day moving averages. Typically, the longer the time frame the longer term and stronger the signal. Shorter term time frame means shorter term signals. In addition moving averages can also be applied to different length charts for different types of analysis. In my first example I chose the 30 bar moving average because that is the one I use most. When my charts are set to daily candlesticks it is a 30 day moving average and then when I move up to a chart of weekly prices it turns into a 150 day moving average (30×5 days per week). If I move down to a chart of hourly prices then my moving average is a 30 hour moving average.
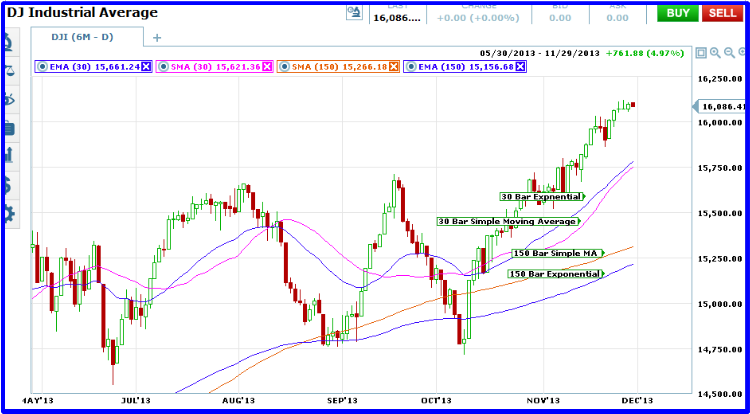
Adding to the mix is the choice of simple or exponential moving average. To recap, a simple moving average is an average of the last X number of data with each data point getting equal weight. As a each day closes it is added to the list and the last days data is dropped off. An exponential moving average is exactly the same except that today’s data is given more weight than yesterday’s and yesterday’s more than the day before and so on down the line until you reach the end of the sample. Because the front end of the data is given more weight it responds to price changes quicker than a simple moving average. It also tracks prices more closely and can give more false signals. If you look at the chart above you can see what I mean. The exponential moving average is moving over and under the simple moving average even though they are set to the same time period. The same is true for the pair of 150 day moving averages.
How To Apple Moving Averages To Binary Options
The answer to that question can take up volumes, maybe shelves, of books. However, there are a few key areas in which moving averages are particularly helpful. The first is trend. A moving average is, or can be, the first step in determining a trend. If the MA is pointing up then the asset is moving higher on average, otherwise known as trending up. If it is pointing down then the asset is trending down. Because you can use different periods with your moving average it is possible to measure trend in more than one time frame on the same chart at the same time. The chart above shows an asset that is trending up in the long term (150 bar MA’s) and sideways to uppish in the shorter term (30 day moving averages). Moving averages can also provide support and resistance targets. The chart above shows an asset that is supported in the long term evidenced by the bounce in prices from the long term 150 bar EMA. Notice how this asset is also getting some volatility when it crosses the 30 bar MA’s. This could be a potential entry signal for binary traders.
Two other important ways that advanced binary traders can use moving averages is for wave analysis and as a coincident indicator. A chart filled with moving averages of different lengths is a basic form of wave analysis and one that can be quite effective. Each moving average provides a targets and signals for entry, when one average crosses another a signal is given, the more averages that get crossed the stronger the trend. The chart below shows what I mean. A series of MA’s can provide accurate wave style analysis and accurate entries for binary options traders. In essence each moving average confirms another as the asset moves higher or lower which leads to my next point. Moving averages are a great coincident indicator. If you are getting a signal from just about any other technical indicator throw a couple of MA’s up on the chart and see what they look like along side your original analysis.