Fed Signals Inflation Concerns as Bitcoin Struggles Below $82K
BTC/USD remains range-bound: $82,000 resistance and $79,200 support to shape the next move.
The Federal Open Market Committee (FOMC) kept interest rates steady on Wednesday, which triggered a short-lived Bitcoin rally. The decision was widely anticipated by market participants and failed to spark a sustained bullish move for the broader crypto market.
During the press conference, Fed Chair Warsh did not provide any clues regarding the future pace of rate moves, but instead reiterated the Fed’s data-dependent approach going forward. This means that inflation, jobs data, and economic growth indicators will be closely watched to assess the Fed’s December move. At the time of writing, the CME FedWatch tool places the probability of a 25 bps rate hike in December at 83%.
The statement that accompanied the rate decision mentioned that inflation “remains elevated” and upgraded the language regarding the economy’s performance from “solid” to “strong”. Two FOMC members voted to raise the interest rate by 25 bps, showing division among policymakers.
Despite Bitcoin’s recent weakness, US-based spot ETFs added $137 million on Wednesday, completing a 3-day inflow streak that totaled roughly $423 million, according to data from Coinglass. While this is not overly impressive, it’s still a positive sign considering that Bitcoin’s price has been ranging below the $82,000 threshold.
Chart Analysis – BTC/USD
Bitcoin has been struggling to hold the psychological support at $80,000 and dropped as low as $79,200 in October. This local low now represents an important support level for short-term price action. A break below it would likely trigger additional bearish pressure and a move towards the next point of interest located at $75,000.
The main level for medium-term price action remains $82,000, which has acted as both support and resistance in recent times. The 50-day Moving Average (blue) is very close to this level, and together they will provide a stronger zone of resistance. If the bulls manage to break it, then the chances of a move to $87,000 (October’s high) will improve.
On Wednesday, the bulls brought the price very close to $82,000 but failed at $81,700. This could be a sign of weakness, indicating that bearish pressure is mounting and the bulls lack strength. On the other hand, it could be a test of resistance before a stronger move up, but there is not enough information at the moment.
The Relative Strength Index (RSI) is neutral, trading in the middle of the range, so it does not provide any clear signals. Next week will be an important one, as the markets are getting ready for the US midterm elections and the Non-Farm Payrolls. Both events are potential volatility boosters that could change the market’s medium-term direction.
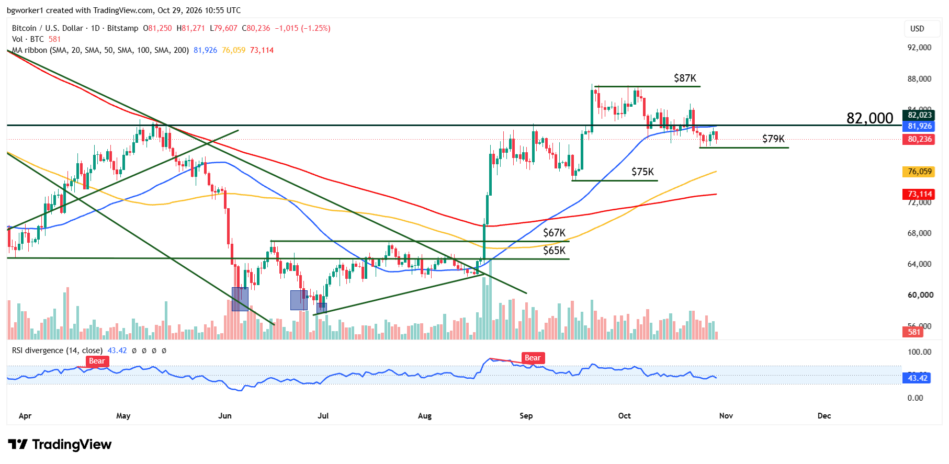
Bitcoin remains below $82,000 after a failed recovery attempt, leaving $79,200 as the key downside level ahead of US midterm elections and jobs data.