Can Bitcoin Withstand Renewed Middle East Tensions?
BTC faces key resistance at $65K while downside risks continue to build
The shaky ceasefire between the United States and Iran is beginning to crumble, affecting Bitcoin and putting pressure on risk assets. On Tuesday and Wednesday, the US carried out attacks on more than 80 targets in Iran. The US military said the strikes were performed in response to Iran’s attacks on three commercial vessels in the Strait of Hormuz.
In a post on X (formerly Twitter), the U.S. Central Command announced that US “forces have started conducting additional strikes against Iran to further degrade their ability to threaten freedom of navigation in the Strait of Hormuz”.
Earlier, at the NATO summit in Turkey, President Trump warned that more strikes are likely to come and declared the truce between the two countries over. The renewed geopolitical unrest is weighing on Bitcoin and crypto in general, but it must be noted that the impact is not major. Before the Memorandum of Understanding (MoU), Bitcoin was sliding lower after each new attack or news of escalation. However, this new round of strikes stopped a BTC rally, but it did not do major damage. Bitcoin dropped from roughly $64,600 to $61,500 and then recovered to around $63,500.
The renewed geopolitical tensions are bringing inflation back in focus due to rising energy prices. This means that a rate hike is now even more probable. Wednesday’s FOMC Meeting Minutes showed that some policymakers see the need for additional rate hikes, while remaining concerned about inflation in general. Now there’s a 63% chance of a rate hike in September, with the odds split 50% for a 25 bps hike and 13% for a 50 bps hike, according to the CME FedWatch tool.
Chart Analysis – BTC/USD
The resistance at $65K is still giving headaches to the bulls and remains an important barrier in front of rising prices. Earlier in the week, Bitcoin had another close encounter with the level, which resulted in a drop in the $61K area.
The price has recovered somewhat, but it is still under pressure, and all bullish moves are short-lived. Unless the bulls can drive the price above $65K soon, Bitcoin risks falling into the $57K area. That area has been battered over and over, so another visit could result in a break. If a bearish break occurs, we could see a move into the $52K – $50K area.
The downtrend is still in play, with all three moving averages above the price and the RSI showing bearish divergence (the price made a lower high but the RSI made a higher high). In the absence of a bullish catalyst (either technical or geopolitical), we can expect to see lower prices.
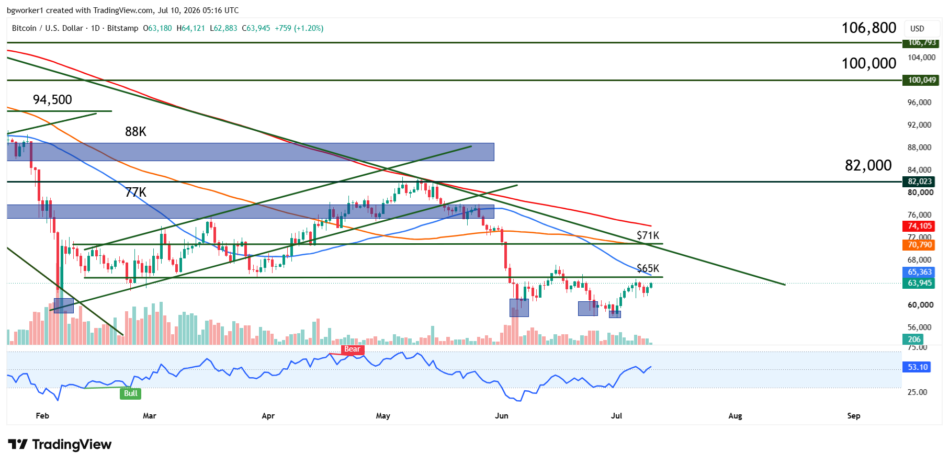
Bitcoin remains below the key $65K resistance as bearish momentum persists, with traders watching the $57K support zone for signs of either a breakdown or a reversal.