Bitcoin Rebounds as Fed Turns Softer and NFP Disappoints
BTC rebounds from $57K as bullish divergence emerges near major support
Bitcoin struggled below the $60K mark earlier in the week, reaching a low at $57,735 on Wednesday before getting a jolt from Fed Chair Warsh’s remarks. At the European Central Bank (ECB) Forum in Sintra, the Chair acknowledged that inflationary risks have subsided in recent weeks, which toned down fears of a rate hike.
The chances of a 25-bps hike in July have dropped from 33% a day prior to the speech to 29%, according to data shown by the CME FedWatch tool. While not a very big change, this still shows that Bitcoin’s correlation with the US interest rate and economy in general is growing. After Warsh’s comments, Bitcoin rose from the $57K low to a high of $61,281 before paring some of the gains.
The recovery was also supported by the ADP Non-Farm Employment Change report, which showed that fewer jobs were created in the private sector than anticipated. The main jobs report, the Non-Farm Payrolls (NFP), showed that 57K new jobs were created during the previous month, which was lower than the forecast of 114K. If inflation is cooling but the jobs sector needs help, then the odds of a rate hike will further decrease. Soon after the NFP release, Bitcoin jumped above $61K.
In the meantime, spot Bitcoin ETFs continue to bleed funds, with 10 straight days of outflows, according to data from Coinglass. The worst day during this period was June 25, with combined outflows of more than $691 million.
Chart Analysis – BTC/USD
Recent price action has established a floor in the $58K – $57K area, and we saw several bounces at this level. The triple bottom was briefly breached, but the price soon recovered, and now we can see that bullish divergence is in play.
Recently, the RSI didn’t enter oversold territory although the price made lower lows. Comparing the last three lows, the first one coincided with an oversold RSI, the next was slightly lower, with a higher RSI – this is already bullish divergence. During the last low (Tuesday, Wednesday), the RSI did not drop below its previous value, thus showing another bullish divergence.
This is a bullish setup, as trading volumes declined with each successive test of the support floor, suggesting that selling pressure is fading. So, technically, Bitcoin has the foundation for a notable rally. But the overall market sentiment is still shaky, and the bias remains bearish, which means that a break of $57K would trigger liquidations and more selling pressure. To the upside, $65K remains a major resistance and hurdle.
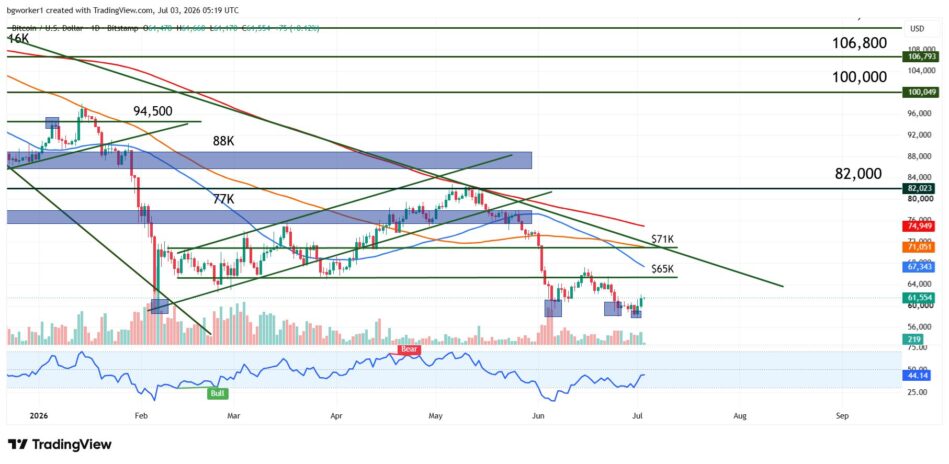
Bitcoin rebounds from the $57K support zone as bullish RSI divergence and declining selling volume hint at a potential trend reversal, while $65K remains the next major resistance.