Bitcoin Hits Historic Highs. Profit Taking Incoming?
Ancient BTC Whale Wakes Up, Moves 80K Bitcoin
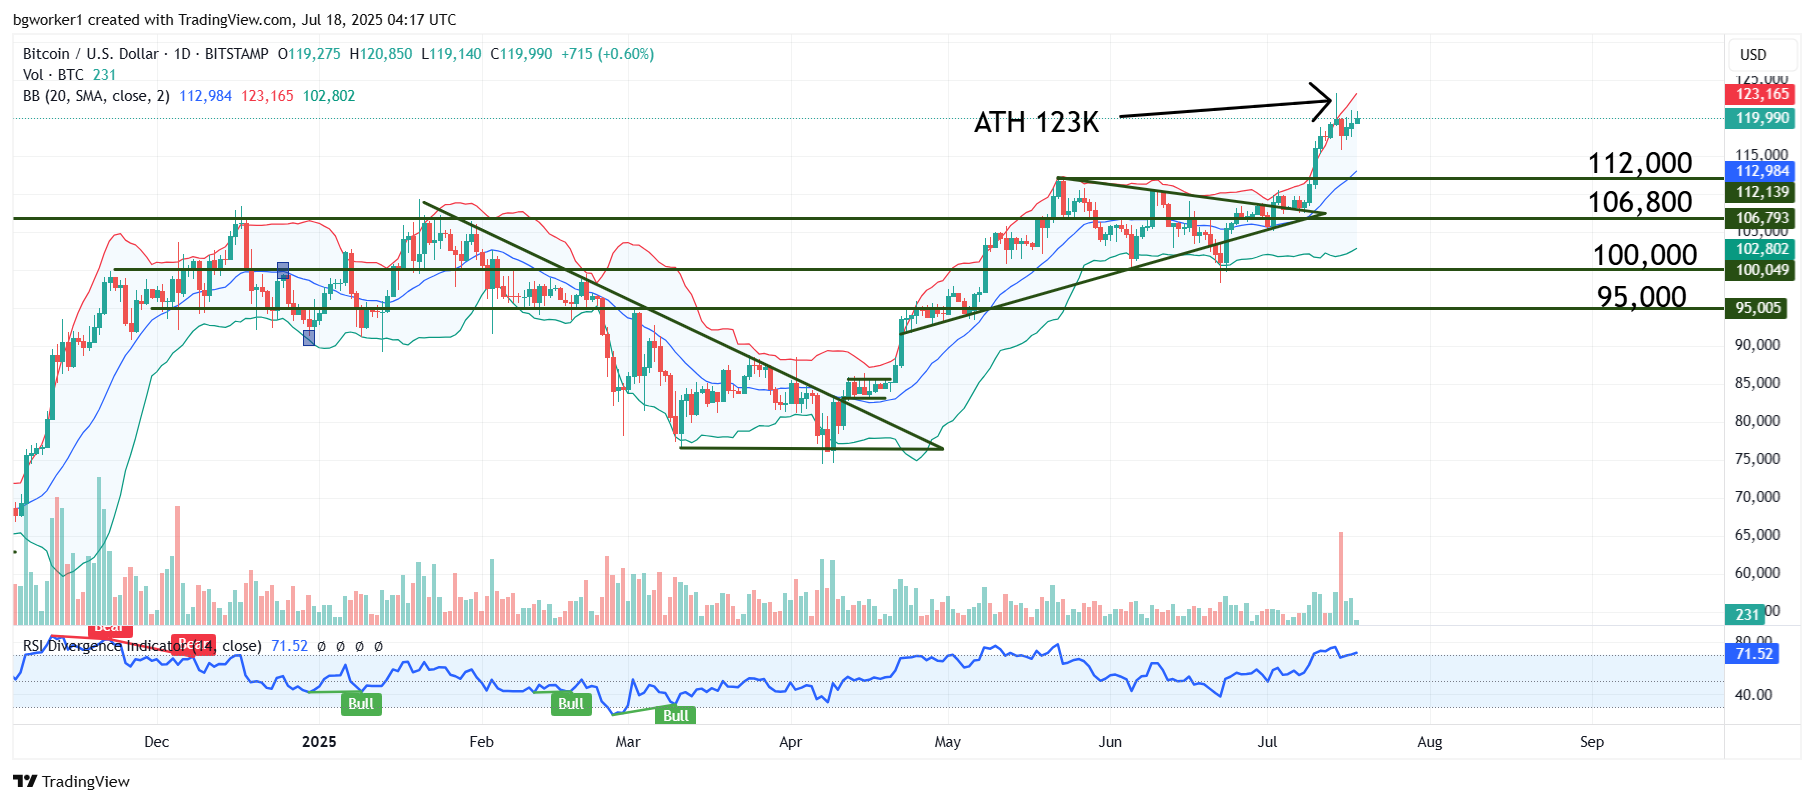
On July 14, Bitcoin hit a new All-Time High (ATH) at $123,236 (Bitstamp data) after a 6-day rally that started after a breakout from around $110K. Although the bullish pressure is still massive, there are signs that a correction may be next.
During the last couple of days, most major altcoins outperformed Bitcoin, which started to waver after hitting the ATH at 123K. On the 1H and 4H charts, BTC is moving sideways, currently trading around $120K. The daily candle on July 14 finished with a long wick in its upper part and a small body; this type of candle is known as a pin bar and is a sign of an incoming correction or the end of an uptrend.
Adding to the idea of a price correction is the massive movement of 80,000 Bitcoin (approximately $9.5 billion) by an ancient whale. It is believed this is a Satoshi-era wallet as it was reactivated after 14 years of inactivity. Some are speculating the wallet belongs to Roger Ver, aka “Bitcoin Jesus”, or the CIA, or even Satoshi Nakamoto themselves. The identity of the owner of the wallet may be less important than the fact that the massive movement probably sparked the price correction that followed the ATH.
According to on-chain data, the funds were transferred partly to the OKX exchange and partly to Galaxy Digital, which offers OTC services. The whale is likely preparing to sell more of their Bitcoin, which would send the price lower, most likely. And considering the historic highs reached recently, probably more buyers will look to sell and bank some profits. On the other hand, some strongly believe that BTC will hit $150K by the end of the year or even sooner, so they may keep holding onto their coins. Regardless of whether this price is reached by year-end, some sort of correction or pause is due.
Chart Analysis – BTC/USD
The rally ended with a massive pin bar and a volume spike visible on the daily chart. Although high volume is indicative of strong, healthy moves and breakouts, when a huge volume bar appears after an extended rally, it may signal the end of the said rally.
The RSI is overbought on the Daily chart and has already shown bearish divergence on the 4H chart, which could be an early sign that a pullback will follow. Also, Bitcoin is underperforming when compared to the major altcoins such as Ripple, Ethereum, and Solana.
The overall picture remains bullish, but in the short term, we may see a bearish bias. The first support is located at $115,700, followed by $112,000. To the upside, resistance is located at the ATH.