4/5 ITM (+90$) trading with RSI and PA
This article was originally contributed by the archived community member Kostasze. We no longer maintain contact details for the original author. The content has been fact-checked and updated for accuracy by our editorial team.
Good Day everyone,
Today I am going to share with you my results and some of my setups. It was a quite profitable day (about +90$ Net Profit) and a 4/5 ITM performance. Not much money because of some silly mistakes but profit is profit. Look at my results.
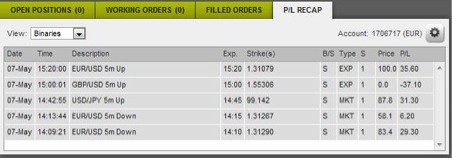
In these trades I used RSI with some changes from my last articles, RSI trendlines and Price Action. The -37 Euro Loss came without reason, I took a trade without evidence and clues, just from my greedy, and of course was OTM. Let’s go to the first screen shot. It’s from the EUR/USD currency pair and I traded in London session.
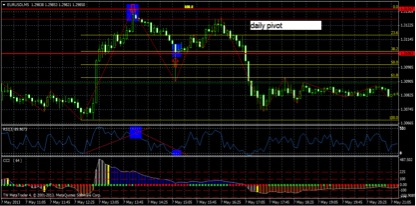
First of all I want to say that I made some small changes to my RSI, the period is now 3 instead of 8(in close) , the overbought zone is 92 instead of 70 and last the oversold zone is 8 instead of 30. My first trade was a put, a little bit risky because was against the mini- up trend. The highest red line in my chart was a strong resistance from the previous day that the price didn’t break. Moreover, our 3 period RSI was overbought and break the trend line I drew (higher- lows, mini-uptrend).The trade was ITM. The third indicator which I have in my chart is a 64 period CCI which helps me to identify the momentum. Above zero bullish (blue color) and below zero bearish (brown color). Notice that now I have a 5min chart ,not a 1min chart.
In my second trade I took a call in the call arrow. The red line is a recent support. Loot at the price behavior. After the reversal in which I took my first trade the price is moving down. Finally hit the 61.8 fib level and you can easily see that we have a very strong rejection here and the candle finally close in the 38.2 fib level. Furthermore the 3 period RSI is now oversold and breaks the trend line I drew (lower-highs, mini- down trend). Notice that our CCI ,when I take the call, is still bullish.
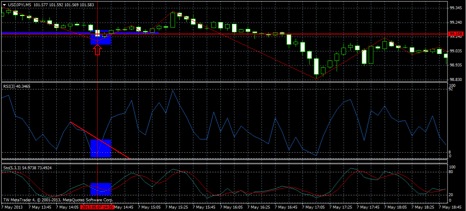
This is another ITM setup from USD/JPY currency pair same to the previous. The 3 period RSI is oversold, RSI’s trend line is broken and we have also a support. You can use RSI with solid results but never ignore the price action and be careful to not trade against the general trend because the oversold/overbought conditions many times don’t work perfectly if you trade against a strong trend. Sometimes the RSI goes sideways in OB/OS areas. For finding the best entry you could use an oscillator like stochastic or you could analyze a smaller TF like the 1min chart.
Kind Regards,
Kostasze