US Dollar Forecast; This Is A Make Or Break Moment For The Bulls
The US Dollar Forecast Is Bullish
The U.S. dollar forecast is bullish. The index has been under pressure in recent weeks but that is over. The FOMCs new policy stance says no more cuts, the latest round of labor data supports that view, and he Dollar Index is showing signs of reversing. The chart is in the late stages
of a double-bottom reversal that could easily take the index back up to retest its recent highs. The indicators support this view in that 1) MACD confirms support at this level and 2) stochastic is doing the same. Both indicators are now set up to fire what I like to call the strong-buy signal, the only risk to traders is that is has not yet come.
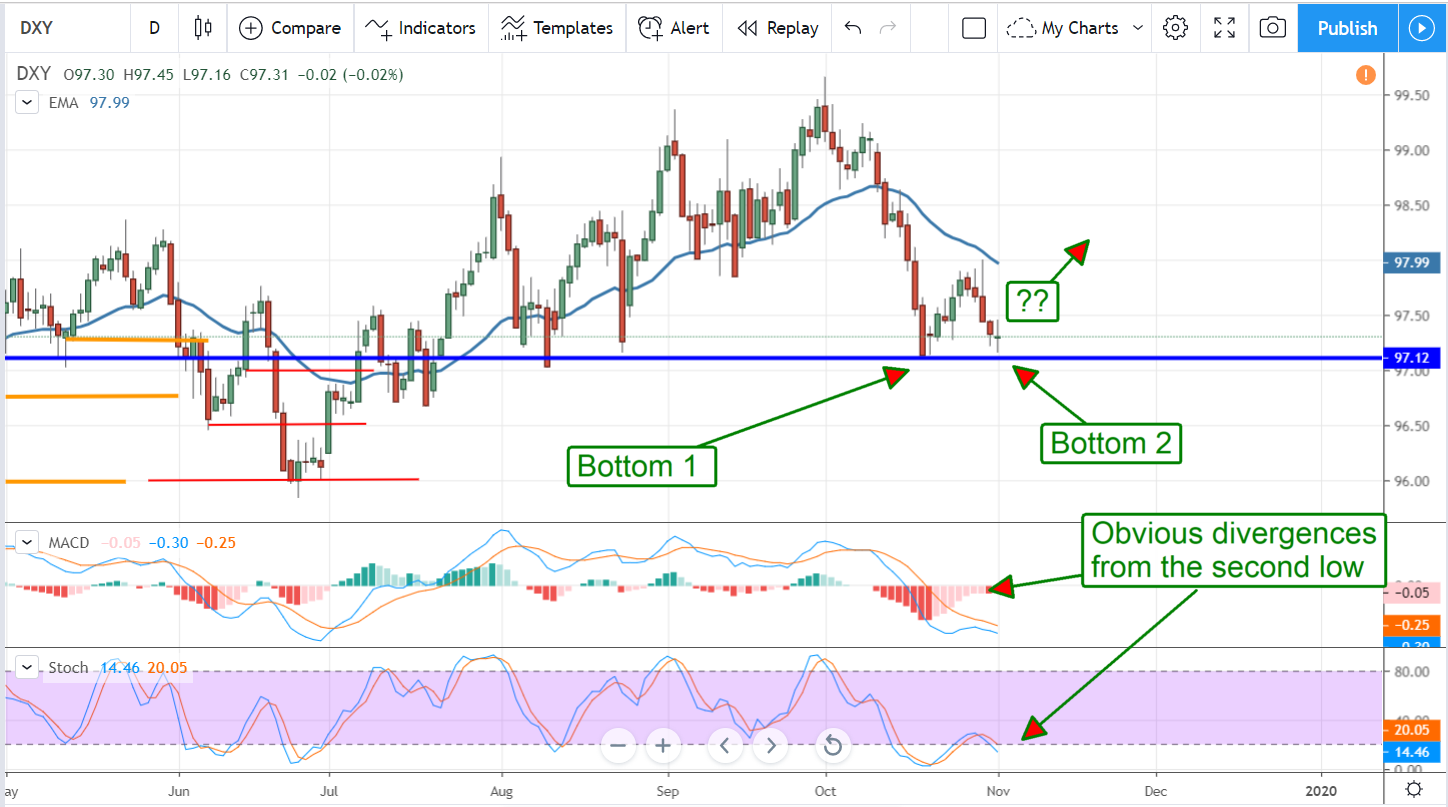
What is the strong buy signal? It is a buy signal that forms when price action confirms a bottom and the indicators confirm the bottom at the same time. What happens is a drop to support, a bounce, and then another drop to support and second bounce. The second bounce is usually higher, starting from a higher price-point, but not always as is the case here. Here we have a double-bottom in process, possibly. What makes this such an attractive possibility is the indicators. The confirm support by diverging from the second low. If the market were heading lower it is likely MACD and stochastic would have created deeper peaks than they did.
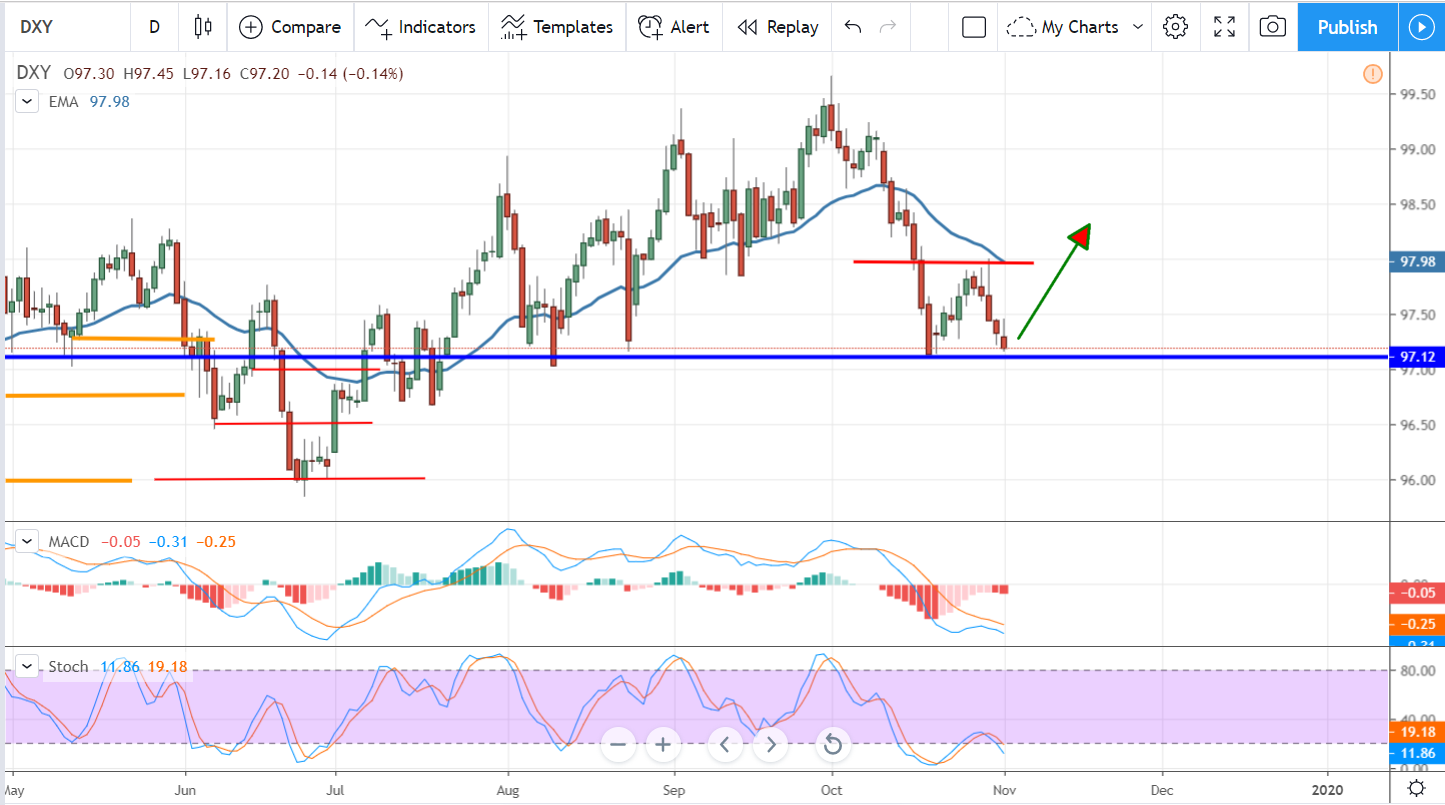
The trick now is waiting for the confirmation. A move up from this level is the first indication a reversal is in progress but not the best. If the move up is confirmed by bullish crossovers in the indicators that’s better but still not the best signal. The best signal will be when the DXY moves up to the $98 level and break above resistance. Resistance is in the form of the short-term moving average but, more importantly, the baseline of the double-bottom that is possibly in play. A move above that level would confirm a full reversal.
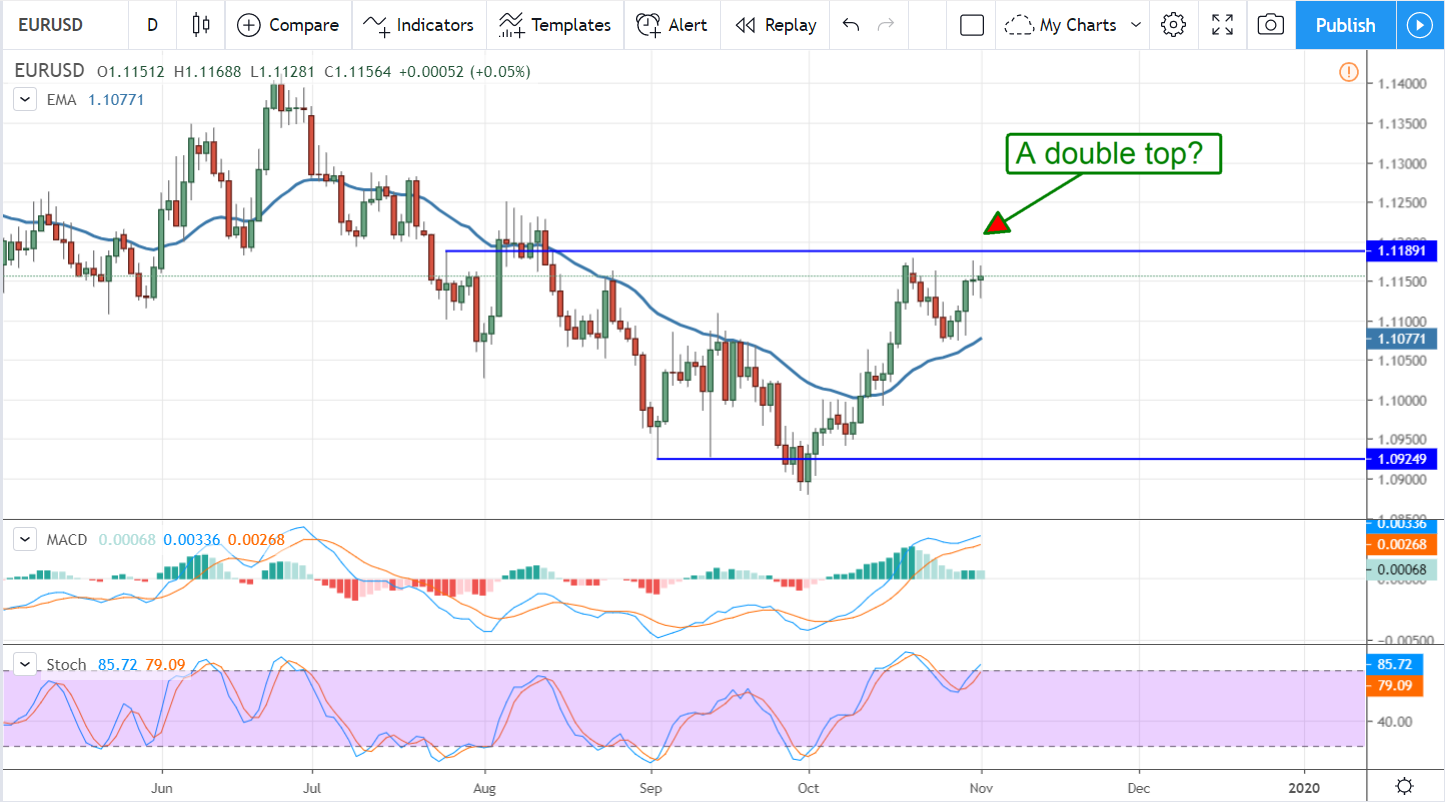
A look at the EUR/USD highlights the potential for reversal. The EUR/USD is forming a potential double-top that is virtually the exact reflection of the DXY. The pattern’s top is resistance just above 1.1155 and noticeably lower than the previously broken support. The indicators are likewise diverging from the new peak and indicate an underlying weakness in the market. The divergence may not result in a reversal for this pair but the outlook is not good. A fall from current levels would confirm the top, a move below 1.10775 would confirm reversal.