The New Improved Smart Contract Cryptocurrency You Should Know About
NEO – The “Chinese Ethereum”.
Dubbed the “Ethereum killer” or “Chinese Ethereum”, NEO was initially launched in February 2014 under the name Antshares and later rebranded as NEO in June 2017. The main digital asset is NEO which is a non-divisible token that generates GAS tokens (the latter is divisible). GAS can be used to pay network and transaction fees.
The project is a community-driven blockchain that aims to create a network of decentralized apps with the ultimate goal of creating a smart economy system. NEO’s most prolific feature is the NeoContract which is a smart contracts system intended to seamlessly integrate the current developer ecosystem. It is compatible with well-known programming languages such as C# and Java in their familiar environments such as Eclipse, Visual Studio, etc. for compilation, debugging and smart contract development.
NEO/USD Technical Outlook – The Big Picture
Currently standing at number 16 in the rankings with a total market cap of just over $450 million NEO is trading at $6.93. Its all-time peak of $162.11 was reached on January 30, 2018.
2018 has been bearish for NEO but that shouldn’t come as a surprise because most cryptocurrencies have been dropping like rocks for the last year. However, NEO was one of the best performing coins during the 2017 bull rush so it’s a bit weird to see it trading almost flat, with no sign of volatility and with all 2017 gains erased.
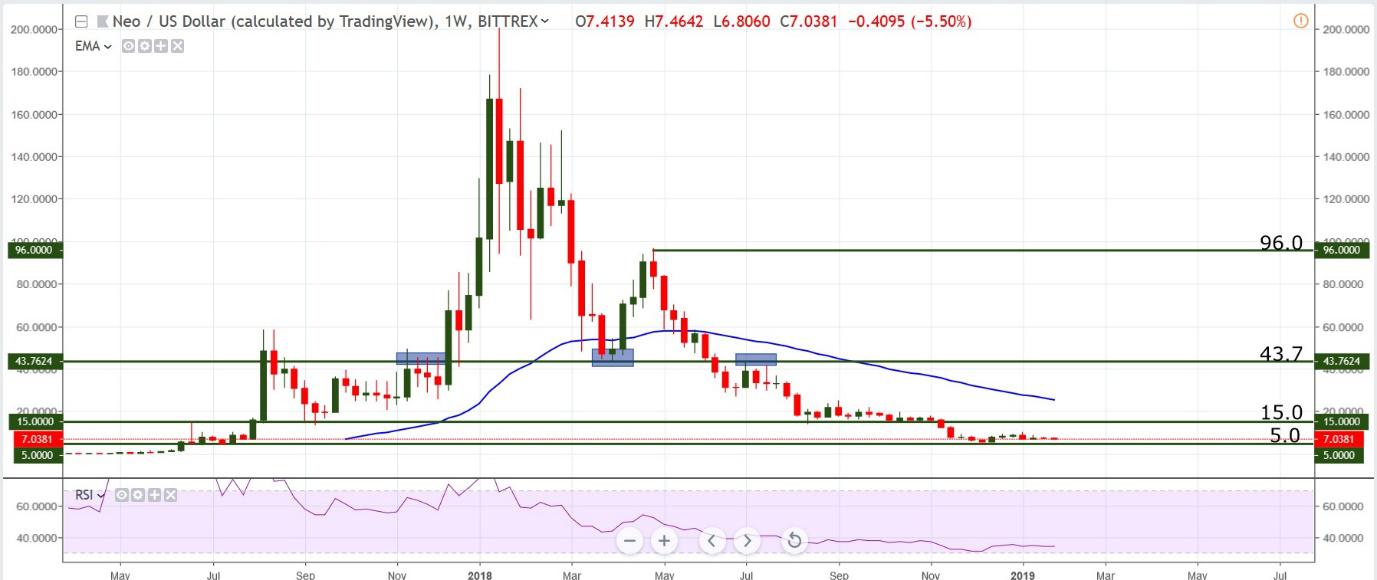
There is a clear downtrend but what’s worrying is that bulls seem to have completely exit the scene. The last time some buying pressure was seen was in early April 2018 when price reached the support at $43.7 and jumped into $96 area. Since then we haven’t seen any type of retracement higher, just a handful of weekly green candles have appeared and none are noteworthy.
The pair is currently trading just above the support at $5.0 and will likely see a break of said support. Under normal circumstances periods of flat movement are followed by strong movements/breakouts, the only question is which way it will go.
A Daily chart tells the same story, with the pair in a lackluster downtrend and low volatility. Support lies at $5.50, minor resistance at $10.0 and potential resistance at $15.0 (this level has not yet rejected rising prices so it cannot be considered confirmed resistance).
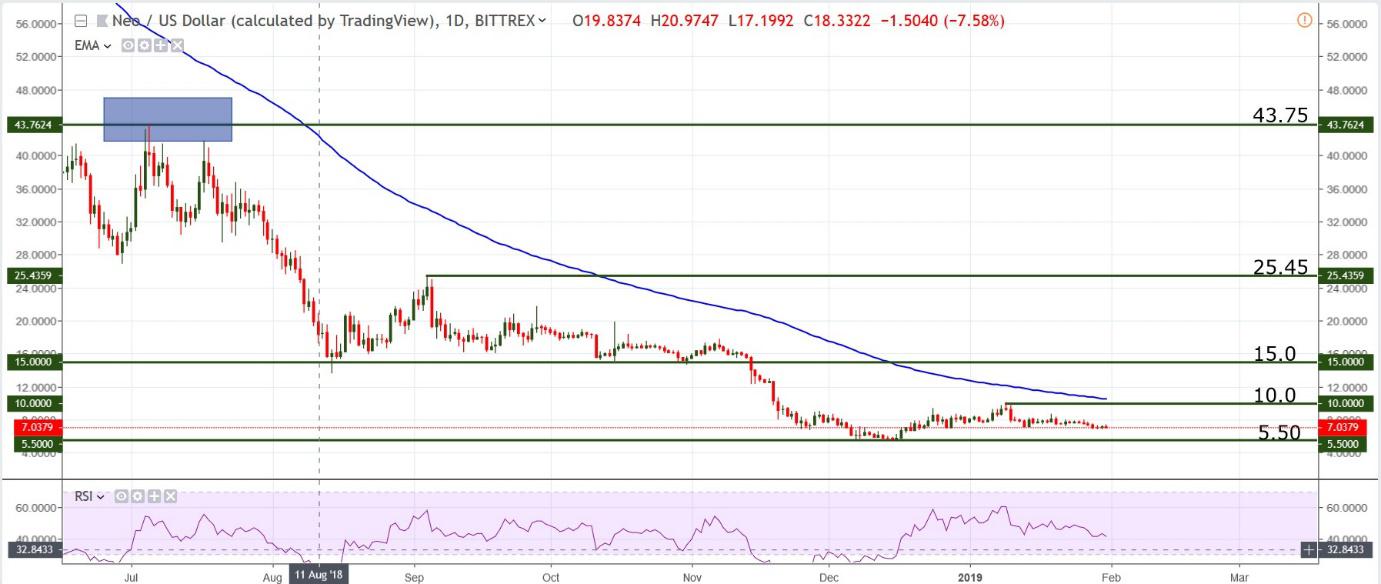
If we are to see relatively significant bullish movement, the first barrier that needs to be broken is the confluence zone created by the 100 days EMA and the resistance at $10.0. Until that zone is surpassed, all moves up should be treated as unsustainable jumps which will soon be reversed. The overall bias is bearish.
Daily Chart Support: $5.50
Weekly Chart Support: $5.0 followed by all round numbers below
Daily Chart Resistance: $10.0, 100 days EMA, $15 and $25.45
Weekly Chart Resistance: $15, $43.7, $96-100
Most likely scenario: break of support, irregular volatility
Alternate scenario: at some point volatility will increase, which will make way for strong breakouts to either side; these are technical scenarios that can be invalidated by fundamental reasons (news, forks, announcements, etc.)