The Inside Story of Bitcoin’s Dramatic Flash Crash to $8,200
Navigating BTC/USD’s Strong Confluence Zone: Chart Insights
For almost two years, Bitcoin’s mystery flash crash to $8,200 remained just that: a mystery. This week, the veil has been lifted and the mystery is finally solved.
And now for some backstory: on 21 October 2021, Bitcoin plummeted to around $8,000. This 87% drop was only seen on a few exchanges, with the main one being Binance.US; also, it lasted just a few moments, so there is a big chance that you’ve missed it. At the time, Binance.US released a statement, saying that the event was triggered by a bug in the trading algorithms of an institutional client.
This so-called “bug” sent Bitcoin from its peak around $65K to roughly $8K ($8,200 or $8,700, depending on the platform) and stirred a massive social media response. However, the price quickly recovered, mostly due to arbitrage trading.
Fast forward to now and we find out that this “bug” in a trading algorithm was actually a manual trade made erroneously by an employee of the trading company Alameda Research. This was recently revealed by a different former employee of said Alameda firm.
The former employee claimed that a “manual trading error” by an Alameda Research trader, not algorithmic issues, caused the sudden price dip. The trader mistakenly placed a wrong decimal when selling a large amount of BTC, triggering a sharp market decline.
While Alameda typically uses adjusted algorithms for high-frequency trades, manual trades, prone to errors, were occasionally made. One such error caused significant market repercussions in October. According to the same source, the mistake resulted in tens of millions in losses for Alameda Research.
The now-defunct Alameda was led by Sam Bankman-Fried, the same person who headed the now-defunct FTX exchange. Can we see a pattern here? The ex-employee highlighted Alameda’s work culture, emphasizing a “move fast” philosophy to seize opportunities, despite potential risks or setbacks. This mindset, promoted by Sam Bankman-Fried, defined both Alameda Research and the now-insolvent FTX crypto exchange.
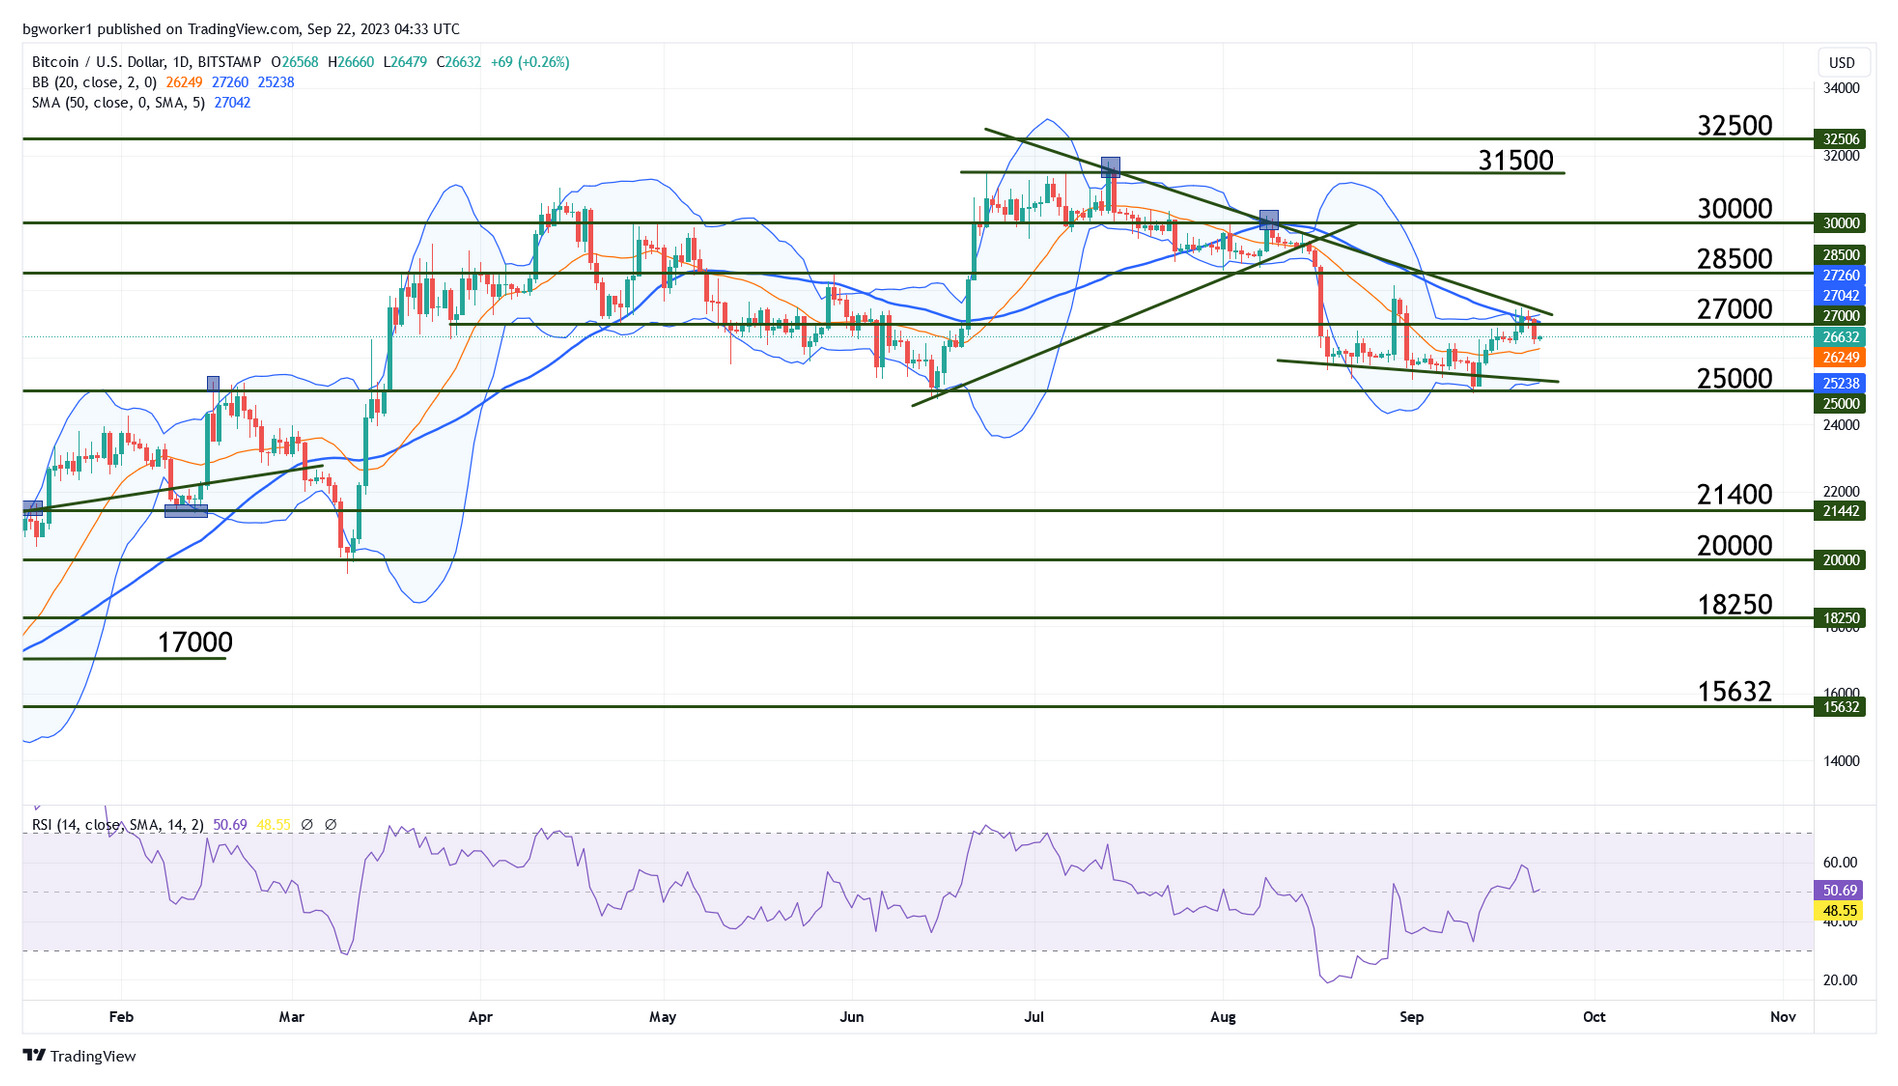
Chart Analysis – BTC/USD
Bitcoin bulls have been enjoying a nice rally since September 12th, after the bounce at $25,000. At the time of writing, BTC/USD is trading at $26,600 and is coming down after hitting a strong confluence zone.
On the chart below, we can see the four resistance items that create the said confluence zone. These include the horizontal resistance at $27,000, the upper Bollinger Band, and the 50-day Moving Average. There’s also the bearish trend line drawn from this year’s high at $31,818.
This cluster of resistance items will be difficult to break, so we may see an extended move south. However, if the bulls do manage to break the resistance, this will show increased pressure and possibly set the stage for a stronger rally.