Head & Shoulders Pattern and Double Tops/Bottoms
Good Day Traders,
Kostasze is here.In this article I will explain with screenshots two patterns that I use very often as I am trading. These patterns are Head & Shoulders and Double Tops/Bottoms and they are well known and very popular in binary options technical analysis.Now, it’s time for the first screenshot of the day. It’s from EUR/JPY currency pair in 12/4.
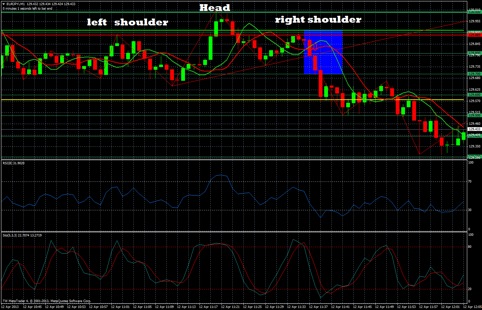
Look at the screenshot. You can see a left shoulder, a head and a right shoulder.I will explain it from the beginning. First of all, as you can easily see we have a resistance in the left shoulder which is near to a whole number and to a daily pivot level,too.After that, the price is moving down and come again to this spot but this time the price breaks the resistance and makes a new higher high and we have now a new resistance.After the reversal the price is moving down again then come back but it stops in the resistance of the right shoulder.This is our spot.You can see that I drew a trend line in the screenshot from the end of the left shoulder to the end of the head.I am waiting for the price to break this trend line after the reversal in the right shoulder and this is a sell signal.Look at the blue box, I have a put arrow when the price breaks this trend line and we should wait for a big movement down.Some traders take their positions in the reversal in the right shoulder, usually with a longer expiry but I don’t do this because I am waiting for the pattern to be ready and I don’t want to chase a pattern.The height of the shoulders should be equal or in many cases the height of the left shoulder is bigger but you should never trust a pattern which has a bigger right shoulder.For the confirmation, you can use RSI, Stochastic.Another popular way to confirm this pattern is the volume.We have usually a bigger volume in the right shoulder , a moderate volume in the head and last a smaller volume in the right shoulder.
Double Tops/Bottoms
Let’s go to the second screenshot from EUR/USD currency pair in 12/4.
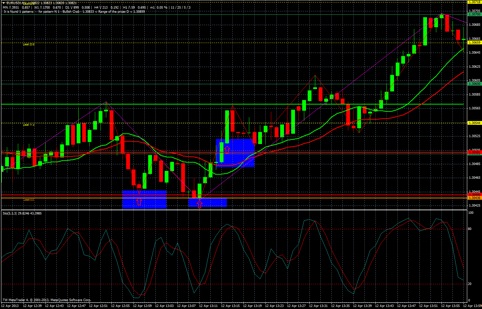
We have a double bottom pattern here as you can see.It looks like a “W”. The red horizontal line down is our support and it’s the low of the previous day,too.It’s usually a reversal area as I said in previous articles.Look athe blue boxes.In the first blue box we have our reversal you could take a call here.After that the price is moving up,makes a resistance in the red horizontal line which is a whole number and comes again to test our support and it can’t break it.You could take a call here,too.After that the price is moving up and now we have our spot.When the price breaks the resistance(it’s a buy signal) you can see that we have a movement up until we have our “W”. Double Tops pattern have the opposite setup and looks like “M”.
Kind Regards,
Kostasze