Ethereum, Will It Ever Move Higher Again
Ethereum (ETH) – Weekly Update And Long Term Price Prediction
Ethereum is an open source, blockchain-powered platform that allows developers to build and utilize decentralized applications (dApps), also known as smart contracts. It is supposed to be the most advanced blockchain on the market and it may be, in theory. In practice it is a flawed platform in need of updates that developers just can’t seem to deliver.
In 2016 the Ethereum blockchain split into Ethereum and Ethereum Classic, following a lack of consensus on how to handle the aftermath of The DAO attack. The new Ethereum was meant to protect against future cyber attacks but still contains vulnerabilities. It is currently trailing Bitcoin in terms of market cap value and is likely to stay in second spot for the foreseeable future.
Ether is the native currency, it has two applications that will overtime help drive its value. Ether can be traded just like any other cryptocurrency and it can be used to run applications inside the Ethereum network. What that means is if another business or enterprise wants to use the Ethereum network for dApps and smart contracts they need to buy Ether to make it work. The problem is other blockchains, blockchains with a focused application, are stealing market share. If Ethereum can’t deliver soon it will become obsolete before it’s even finished.
Ethereum (ETH) Price Analysis – The Big Picture
ETH reached its all-time high of $1,420 on January 13, 2018 and it’s been all downhill from there. The token is currently trading at $137 with a market cap valued at $14,448,995,590 which makes it the second-largest cryptocurrency by value.
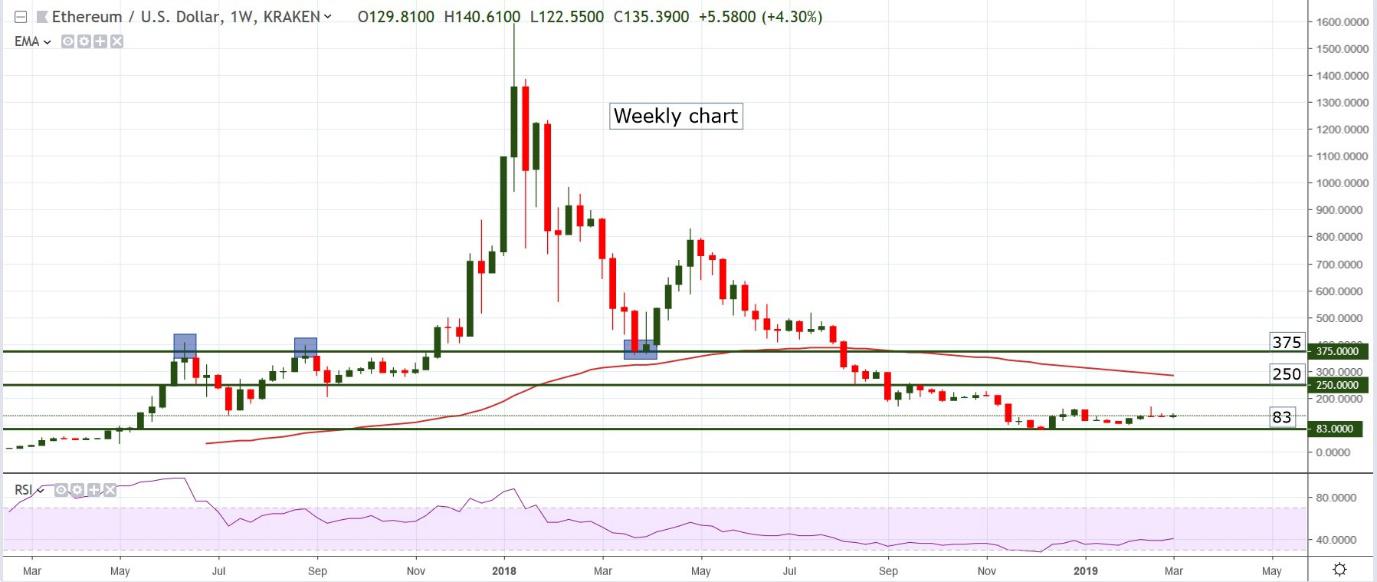
ETH/USD is in a clear downtrend, with lower lows and lower highs printed throughout the entirety of 2018. When it reached the low at $83 the Relative Strength Index (RSI) moved below its 30 level for the first time showing oversold conditions on a weekly chart. This has sparked some buying interest which could take the pair into the resistance at $250 in the next 3 to 6 months. The caveat is we cannot disregard the obvious downtrend while there is no good news. Until we get a positive catalysts and a significant higher high is printed all moves up should be treated as retracements, not reversals.
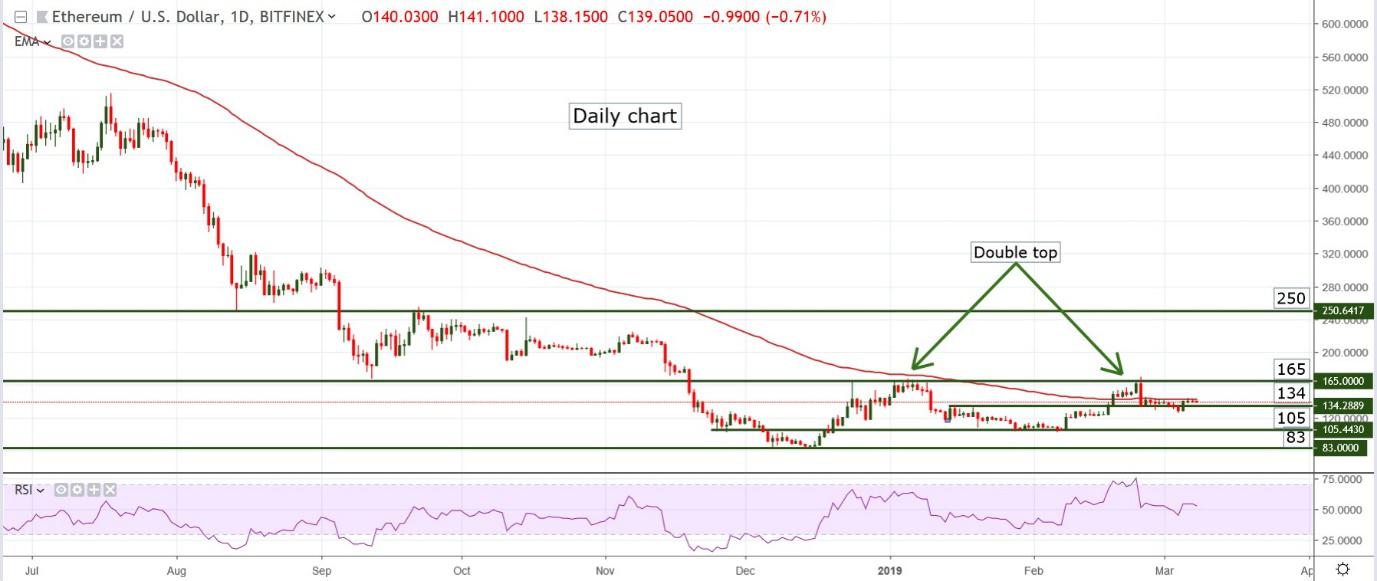
Things look a bit better on the daily chart than on the weekly one. We can see some bullish pressure and an exhausted downtrend that may result in a reversal. The bulls and bears are currently contending for the $134 level and the 100 days Exponential Moving Average, a move above that would be bullish. If the bulls win we will likely see another attempt to break $165 resistance, otherwise ETH could head towards $100 in the medium term.
Side note; there is a double top at $165 which is a bearish chart pattern. It shows that this resistance level has some strength. A break of $165 would prove the bulls are committed to taking the pair higher with a target of $250 over the next few months.
Daily Chart Support: $134 (currently tested), $105, $83
Weekly Chart Support: $80 – $83 (zone) and all round numbers below it (70, 60, etc.)
Daily Chart Resistance: $134, 100 days EMA, $165, $250
Weekly Chart Resistance: $250, $375
Most likely scenario: new attempt to break $165; if successful, the next target will become $200 followed by $250
Alternate scenario: a triple top is formed at $165, followed by a drop into $100 area