Derivatives Traders Get a Massive Hit from the BTC Yo-Yo
$38K: An Insurmountable Barrier… At Least For Now.
In the past week, the Bitcoin roller-coaster has been working overtime, and the apex cryptocurrency experienced dramatic fluctuations, making massive gains on Wednesday and erasing them on Thursday.
In just 7 days, Bitcoin came within a few dollars of the $38,000 level three times. Last Thursday, the pair reached a high of $37,978 and this Wednesday it touched $37,975, just to mimic the same behavior a day later, reaching $37,960. A price difference of just 3 dollars for the first two touches and an overall 18-dollar difference for the three of them is almost unheard of, especially in such a short amount of time. This just goes to show how important $38,000 really is.
At the time of writing, Bitcoin is changing hands at $36,300 after a hefty drop experienced on Thursday. Often, a large number of sell orders accumulate near significant price milestones. As Bitcoin approached $38,000, these sell orders got filled, causing the price to drop. This decline was exacerbated by the liquidation of leveraged long positions.
This back-and-forth movement made a big splash among derivatives traders. The result was the liquidation of leveraged positions worth approximately $340 million, according to data from CoinGlass.
Most of the other cryptos followed Bitcoin on the way down, with Ethereum down 3.61% and Solana (SOL) being the biggest loser in the last 24 hours: it is down more than 11%. However, SOL is also the biggest gainer in the CoinMarketCap’s Top 10, adding 26.60% in the last 7 days.
The second place belongs to Dogecoin (DOGE), with a 9.32% gain in the last 7 days. The biggest gainer just outside of the Top 10 is Avalanche (AVAX) with a whopping 79.40% increase during the last 7 days. Even more impressively, its price is up 13.50% for the last 24 hours as well, disregarding the trend of its bigger brethren.
Chart Analysis – BTC/USD
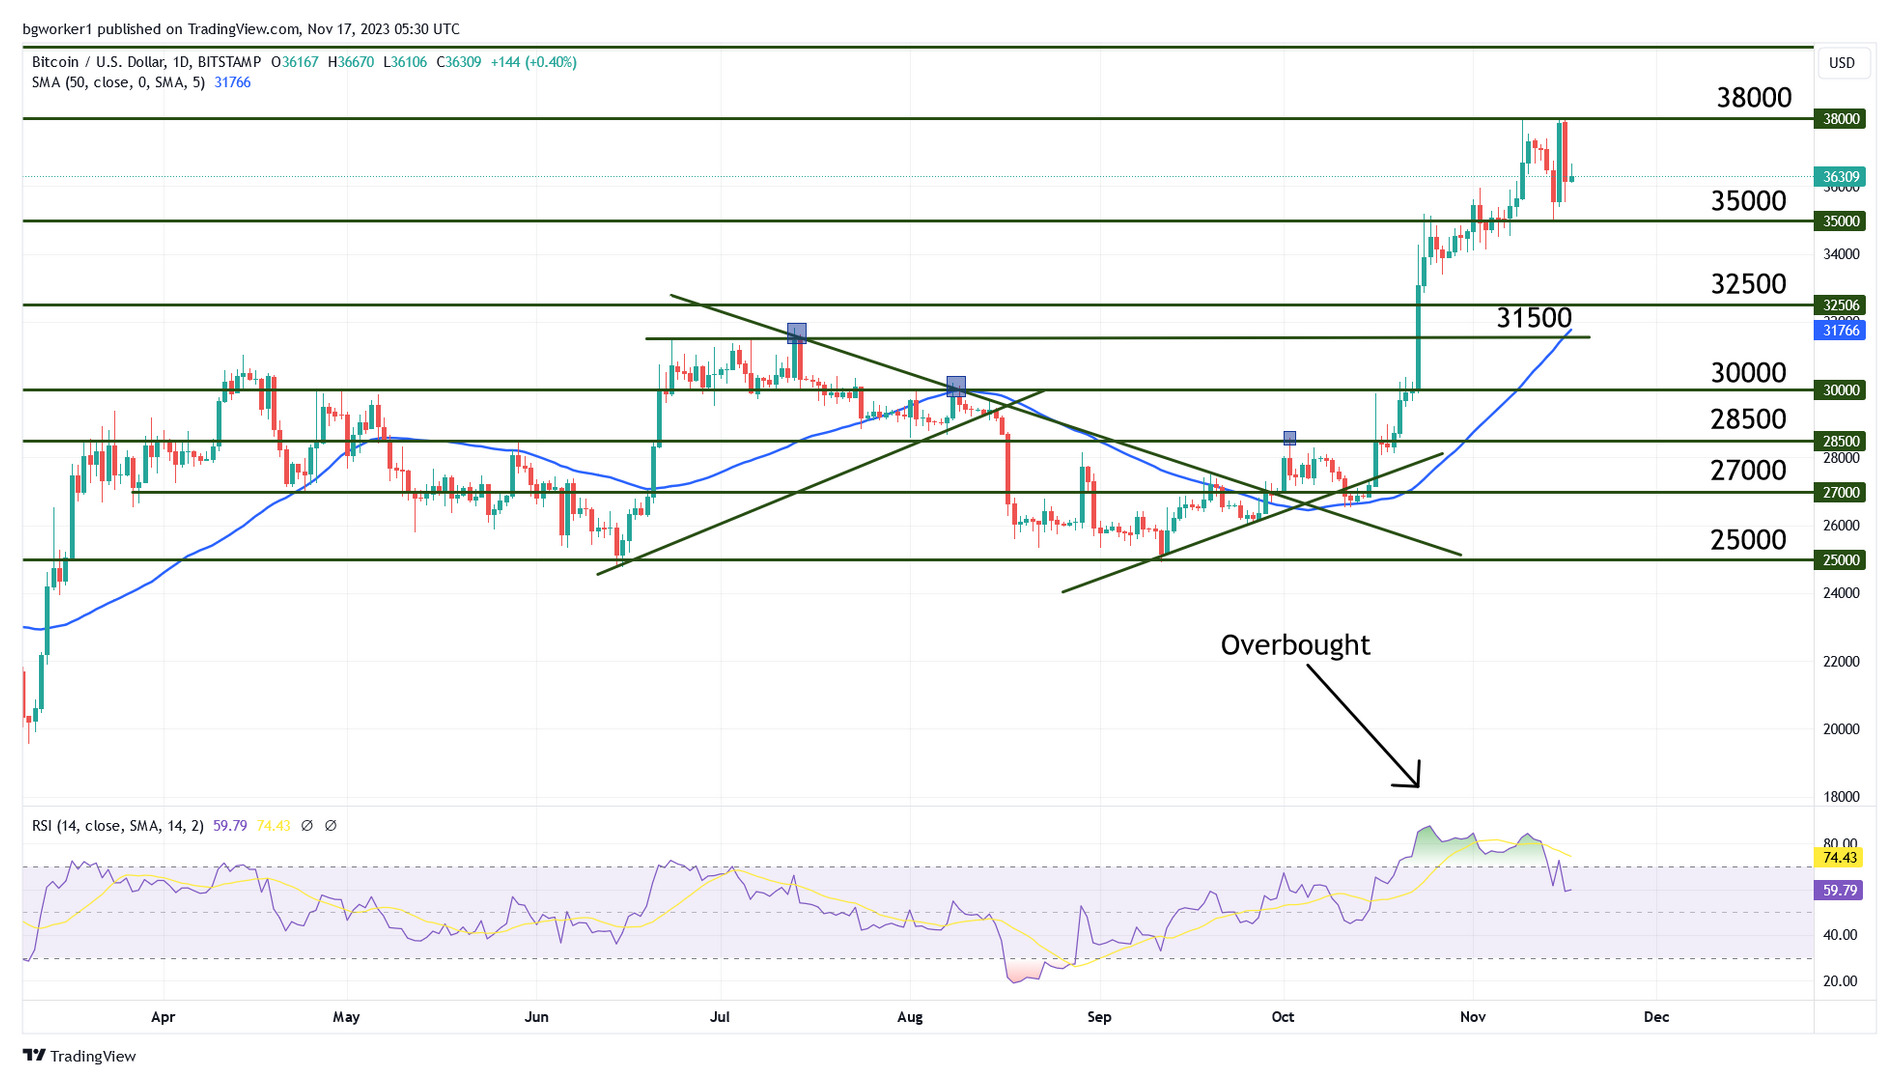
The recent price action clearly showed the importance of the resistance level at $38,000. We now have a double top at this level, which is a very strong bearish pattern. Some might even call it a triple top but the third touch is mostly because the candle started very close to the level (the previous, green candle touched the level).
Prior to the first touch of $38,000, the RSI was already indicating an extreme overbought condition and was showing bearish divergence: the price was making a higher high and the indicator was making a lower high. We’ve talked about divergence many times and I can’t remember the last time it failed, so this drop doesn’t come exactly as a surprise.
Considering the recent price action, it may be a while until $38,000 is broken decisively. We could see a period of ranging movement between $35,000 and $38,000, at least until the market accumulates enough orders to stage a breakout.