Bitcoin Starts to Swell: Pre-FTX Levels Reached!
Resistance Ahead, Divergence in Play.
After spending a long time trapped in a tight range near $17,000, the apex cryptocurrency looks to be going back to the volatility we’re used to. At the time of writing, Bitcoin is changing hands at $20,950, which is almost the exact price it was trading at before the FTX crash.
In late October 2022, BTC/USD broke the $20K barrier and in early November, it successfully re-tested the level from above. A successful re-test means that the previous resistance turns into support and is a sign that the break will generate additional upside movement.
Things were looking good for Bitcoin but then, one of the biggest crypto exchanges – FTX – crashed and burned, which stifled BTC’s recovery and sent it straight down to $15,600. Investors and traders were already in a risk-off mindset and the demise of a massive exchange couldn’t bring anything good.
The fact that Bitcoin is now trading at the same level as it was before the FTX crash could be a sign that the market is becoming more optimistic and that investors are starting to view Bitcoin as a viable asset once again.
Moreover, the Fed is likely to add only 25 bps to the interest rate and the U.S. economy is showing signs of slowing down, which weakens the US Dollar and allows Bitcoin to climb. But that doesn’t mean that the road will be easy. Here’s why:
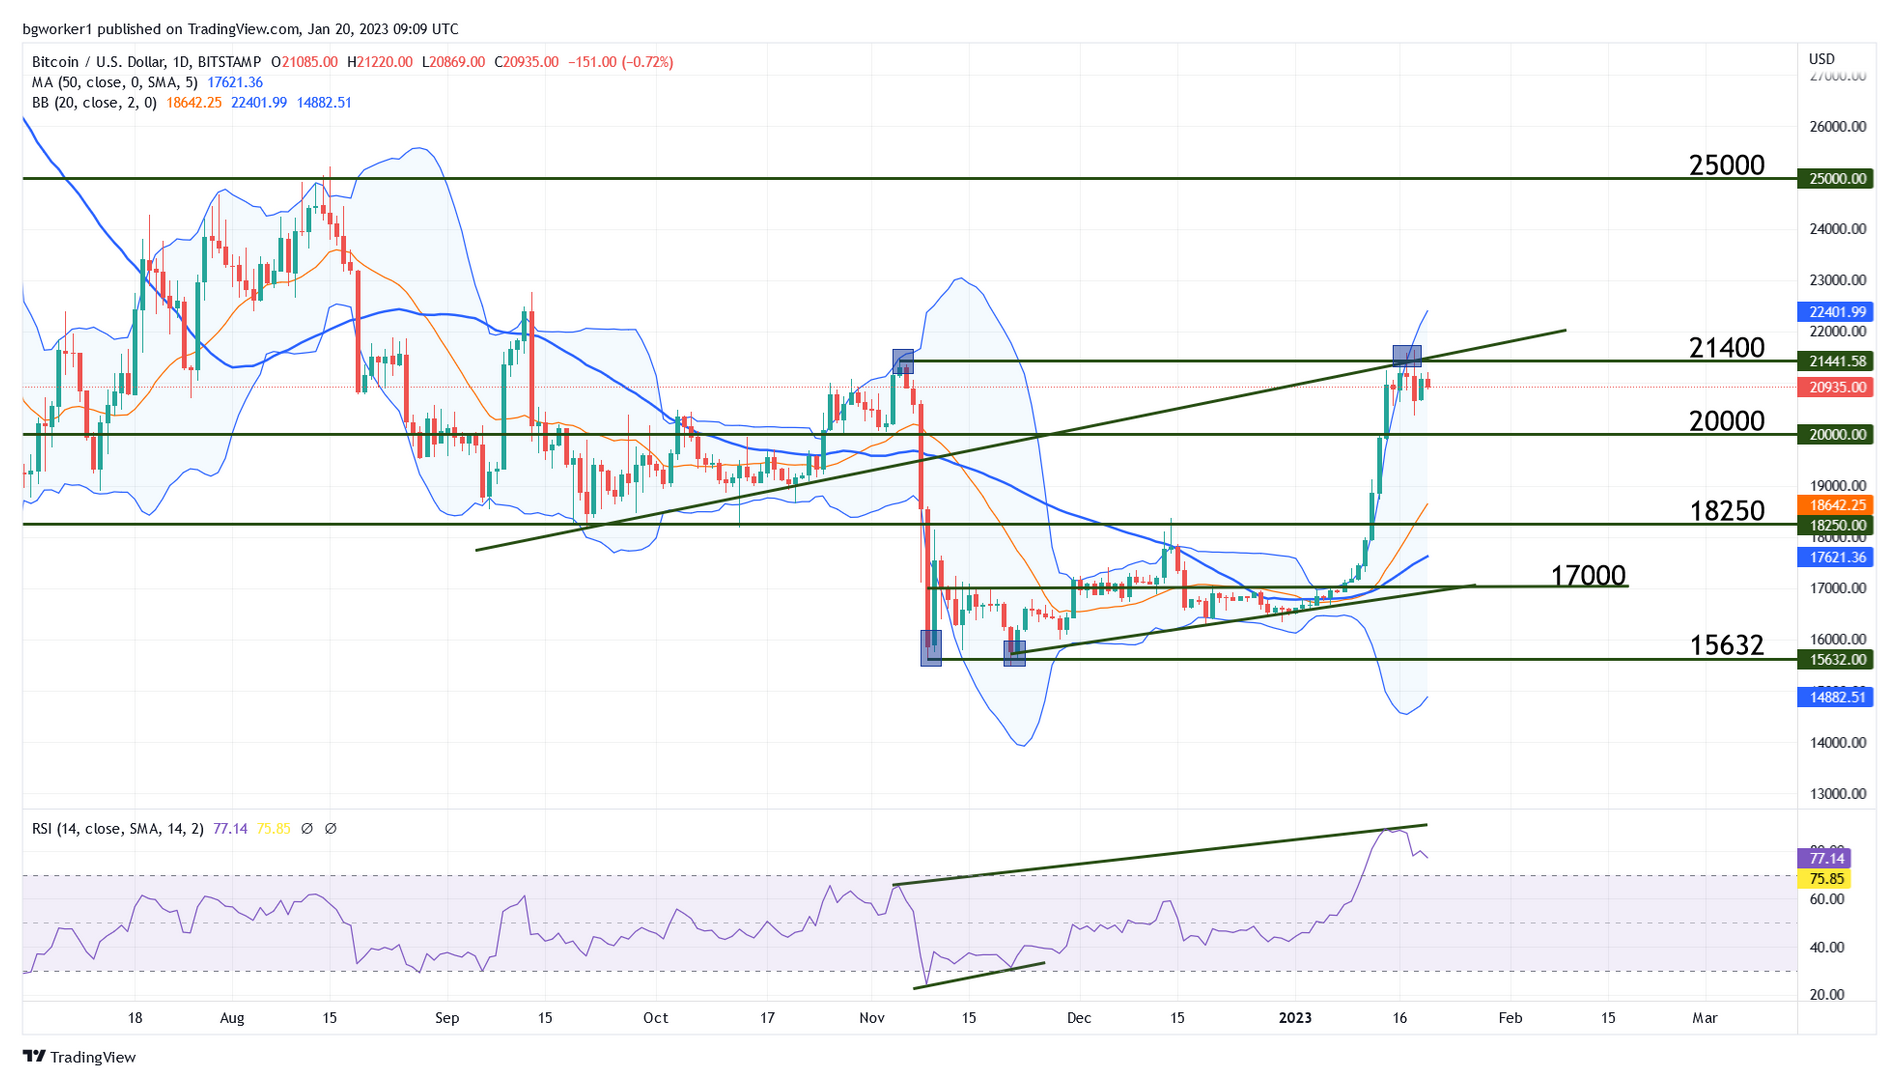
Technical Outlook – BTC/USD
After reaching the resistance at $21,400, Bitcoin’s rally paused and the price dropped to a low of $20,360. This created the double top that is visible on the chart below (the pre-FTX high and the current one).
Back in November 2022 (the first top in the double-top formation), the RSI was not overbought and there was no major resistance ahead. Thus, it appeared that the pair can continue upward (which ultimately didn’t happen due to the FTX debacle).
Fast forward to this day and we can see that BTC/USD is facing several types of resistance. Horizontal resistance sits at $21,400 – $21,500; diagonal resistance is offered by the lower side of the bullish trend line seen on the chart. A double top is present, the RSI is deep in overbought territory, and bearish divergence is at play (the price is making a double top but the RSI is making a higher high).
This heavy resistance cluster suggests that we are dealing with a relatively high probability of a pullback. A potential target for the said pullback is the always important level at $20,000 but on the other hand, the price did retrace a bit already.
Is this small pullback enough after such a big climb? Probably not, so we are likely going to see either a stronger one or a ranging period. A break of the resistance zone could trigger additional bullish movement.