Bitcoin Recovery Builds Despite War Risks and ETF Outflows
Weekly RSI divergence hints at a broader recovery attempt.
Bitcoin has recovered above the critical $60K level after falling as low as $59,100 during last week’s trading session. The US inflation numbers came out on Wednesday, with mixed implications for Bitcoin. The month-on-month Core CPI eased to 0.2% (previous: 0.4%; expected: 0.3%), which reduces the probability of a rate hike this year. However, the year-on-year headline CPI rose to 4.2%, the highest it’s been since 2023.
Rising inflation keeps investors nervous because it can lead to a more hawkish Fed and potentially to a rate increase, which would hurt risk assets such as cryptocurrencies. At the time of writing, there’s zero chance of a rate hike at the June meeting, but the odds rise gradually, reaching a probability of 43% of a 25-bps hike by the end of the year, according to the CME FedWatch tool.
Bitcoin is also under pressure from the Middle East conflict that escalated again this week, with the US launching multiple strikes on Iran after the latter shot down an American Apache helicopter. Iran did not confirm the shooting and launched its own strikes.
The current situation shows that a peace deal is a distant prospect, which means that Bitcoin’s recovery will have to wait. It’s not a given that BTC will rise as soon as the war is over, but at least that could be a catalyst, which would alleviate much of the current bearish pressure.
In the meantime, spot Bitcoin ETFs continue to bleed, with roughly $1.8 billion exiting the market since the beginning of June, according to data from Coinglass. During this time, only one day saw overall inflows, but the number is almost insignificant: just $3.2 million.
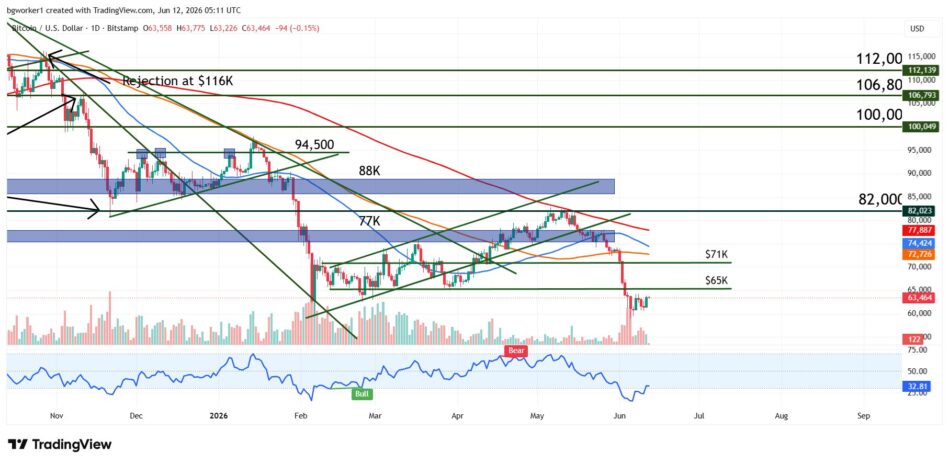
Chart Analysis – BTC/USD
The pair started a timid recovery after falling in the $59K zone, but at least for the time being, this does not look like the end of the downtrend. However, a move above $65K could be the trigger for a stronger recovery.
This year’s price action shows a double bottom at $59K, and the weekly RSI shows bullish divergence (the price created a double bottom, while the RSI printed a lower low). On the daily chart, the RSI is also moving up after a visit to extreme oversold territory, which further supports the idea of a rally.
This setup has the potential to generate a healthy bullish move, but the fundamental side is not allowing Bitcoin to respond to the technical signals.
Bitcoin rebounds from the $59K support zone, with bullish RSI divergence and a potential double-bottom pattern pointing to a recovery if bulls can reclaim $65K.