Bitcoin Drops for Two Days Straight. Should You Care?
Guest auther Bogdan Giulvezan
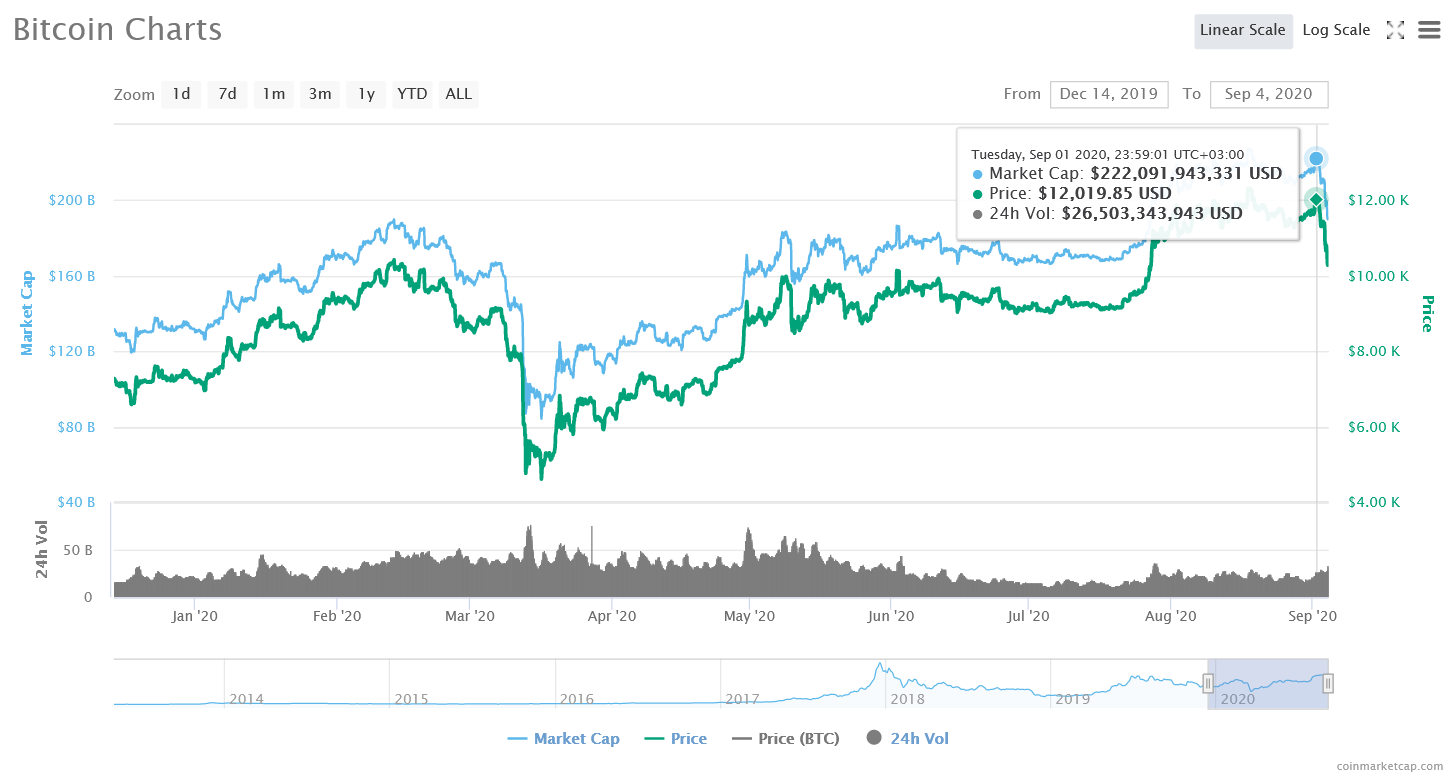
After reaching a high of $12,019.85 on Tuesday, Sept. 1st, the undisputed king of the crypto space – Bitcoin – slumped to a low of about $10,300 on Friday, Sept. 3rd. That makes it two straight days (Wednesday and Thursday) in the red. Furthermore, over the last 7 days, Bitcoin is down -10.12% at press time (data provided by CoinMarketCap).
Of course, leveraged longs were dealt a bad hand and forced to play it. Too bad for them but is this something we should worry about for the long term or is it just a normal pullback in a healthy uptrend? Well, as they say, the proof is in the pudding, and in our case, the signs are on the Bitcoin chart, so let’s look at one:
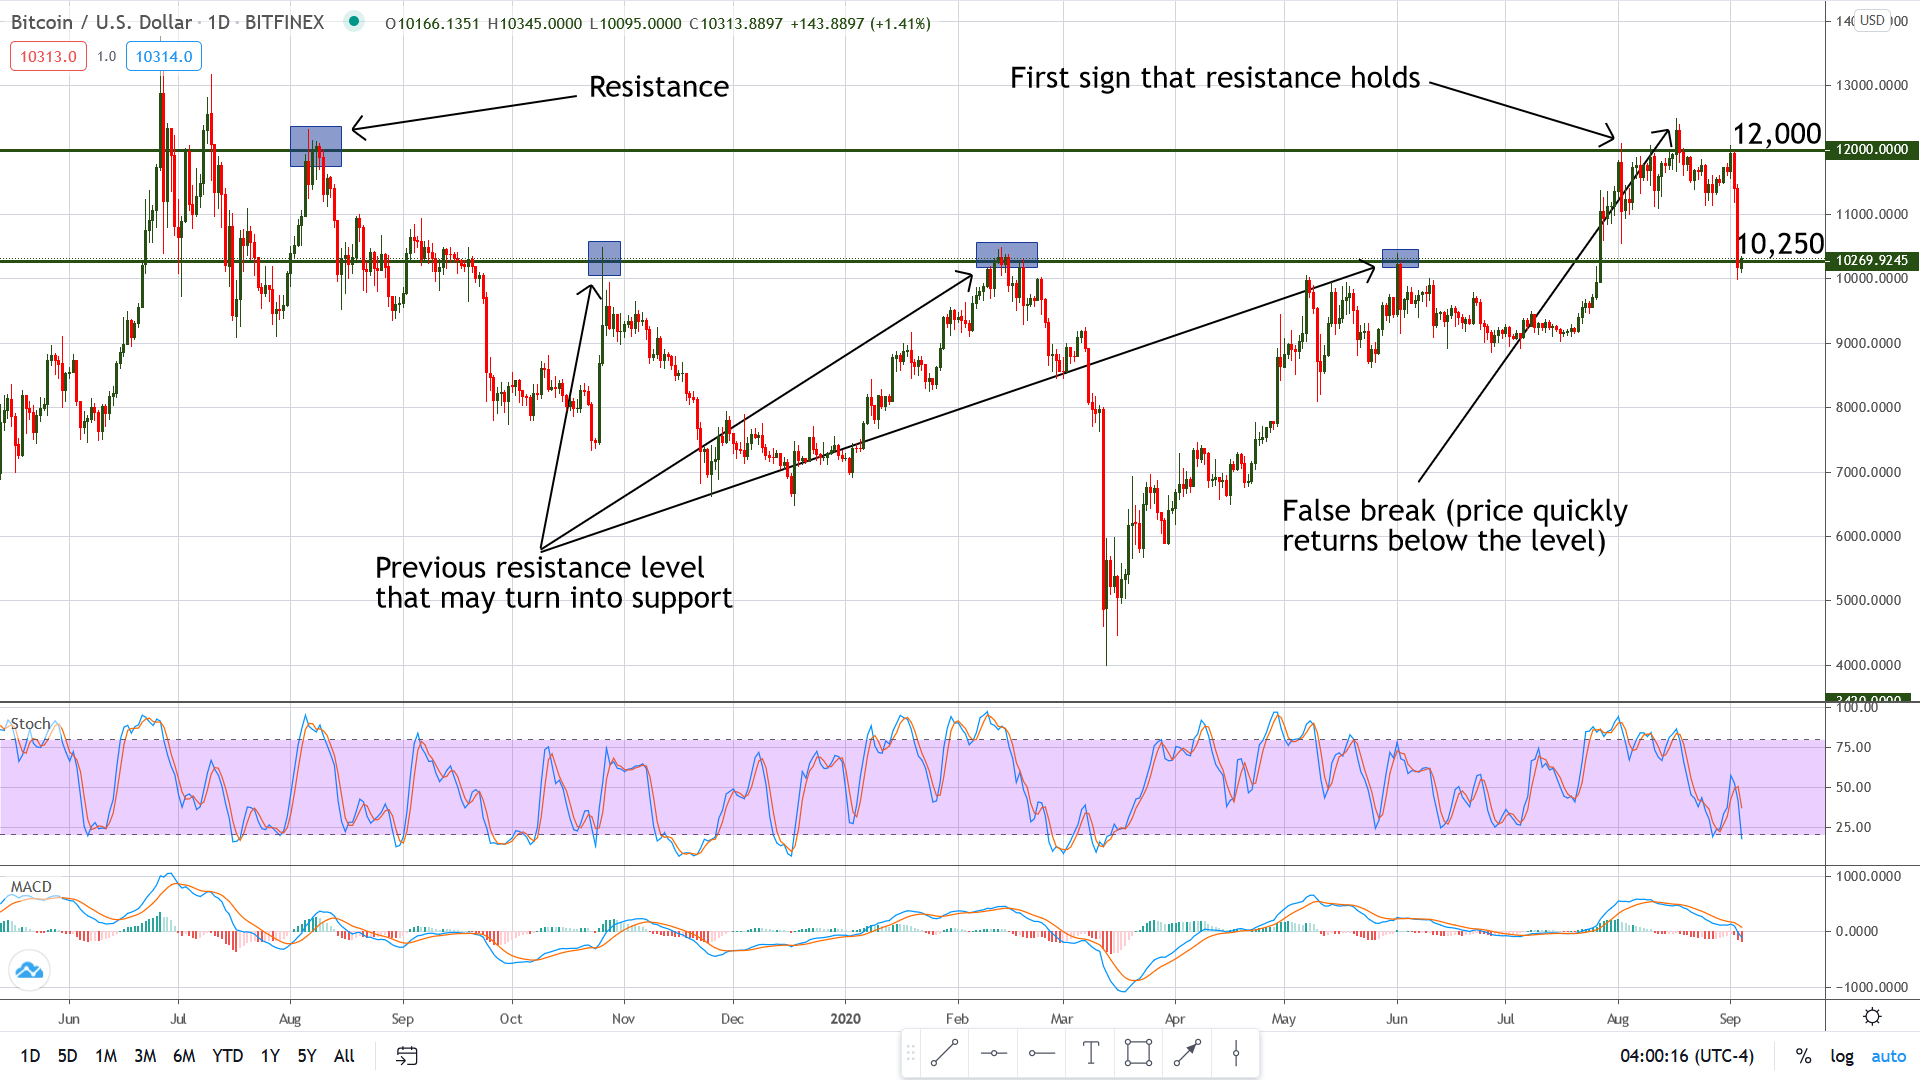
Looking on the left (first blue rectangle), we can see that price tried to surpass $12,000 but failed to do so and returned below the level right after, a behavior that generated an extended period of bearish movement (corroborated with other factors, of course). This price action established $12,000 as a strong resistance level and one to be aware of in the future; on top of this, $12,000 is a BRN (Big Round Number), and these numbers are considered strong S/R.
Fast forward to the right of the chart and we can see that price tested $12,000 in early August but it failed to surpass it although the bulls had good momentum (price was moving strongly up). That was the first sign that resistance is holding and this was later confirmed by a false break where price moved above the level only to return below it soon after.
Add to all of this the fact that the Stochastic was overbought (above 80 level) and the MACD was just crossing to the downside and the picture becomes clearer: we had clear signs that upwards momentum is fading and downside pressure is building up. After a final attempt to break $12K (Tuesday), price tumbled and is now testing the major psychological zone of support located around $10,000.
Where Do We Go From Here?
If we would know for sure, we would all be gazillionaires, but obviously, we don’t know for sure. So what we can do is analyze charts, create scenarios, and prepare for them. Returning to our chart above, we can see that the zone around $10,250 rejected rising prices at least three times in the recent period so we can safely say that this level was resistance. Often time resistance turns into support and if this is the case, we may see a bounce up from here. Just keep in mind that previous resistance doesn’t automatically turn into support, it’s just a possibility.
If the current level doesn’t hold, the next possible turning point is located around $9,000, which is both a BRN and a confirmed technical support level because price bounced up from there in the past. If you would ask me, I’d wait with any longs until I see clear signs of a bottom and a push up (at least on the lower timeframe charts). But then again, don’t ask me, you’re all grown-ups.