GENIUS Act Milestone, ETF Inflows Fail to Sustain BTC Rally
BTC/USD tests the 50-day moving average after rejection at $84,800
Bitcoin moved past $84,000, but it got rejected at $84,800, and now the bears are once again challenging the key level at $82,000. The bullish move coincided with large Bitcoin ETF inflows and a final rule on the GENIUS Act, implemented by the US Office of the Comptroller of the Currency (OCC).
Spot Bitcoin ETFs attracted over $1 billion over the three days of the week, according to data from Coinglass. Monday saw $526 million in inflows, and almost the same on Wednesday ($524 million). However, Tuesday only brought in $23 million. BlackRock’s IBIT fund drew in the bulk of the inflows on Wednesday, with $235 million, followed closely by Fidelity’s FBTC fund with $212 million. On Monday, the story was a bit different: IBIT brought in $665 million, but FBTC saw an outflow of $83 million, bringing the total figure of the day lower.
The OCC’s final rule regarding the GENIUS Act established requirements for permitted payment stablecoin issuers, among other things, marking another step toward stablecoin adoption. According to the Comptroller of the Currency, Jonathan V. Gould: “We are providing a clear, practical framework for payment stablecoin innovation, with strong standards for reserve backing, redemption, and risk management.”
The US Treasury Secretary Scott Bessent called the GENIUS Act “a watershed moment in American finance, further cementing the United States as the crypto capital of the world” and compared it to President Abraham Lincoln’s National Currency Act of 1863 that established a national framework for bank-issued currency.
The buzz created by ETF inflows and the OCC’s ruling dissipated on Thursday, and Bitcoin returned to levels previously seen at the beginning of the week. Now Bitcoin is again at a crossroads, with the Fed interest rate decision and inflation data fast approaching.
Chart Analysis – BTC/USD
The level at $82,000 is once again in focus because Thursday’s price action can turn into a retest of previously broken resistance or a return below the level. If the price returns below $82,000 and closes a full daily candle below it, then the probability of a breakdown will increase.
The 50-day Moving Average (blue line) is very close to the current price, so it creates a confluence zone together with the horizontal level at $82,000. If this support zone pushes Bitcoin higher, then it will face another resistance at $84,800, which was this week’s high.
On the other hand, if the bears manage to take the price below the confluence zone, Bitcoin is likely to drop into sub-$80K levels, with support at the previous local low, positioned around $79,500.
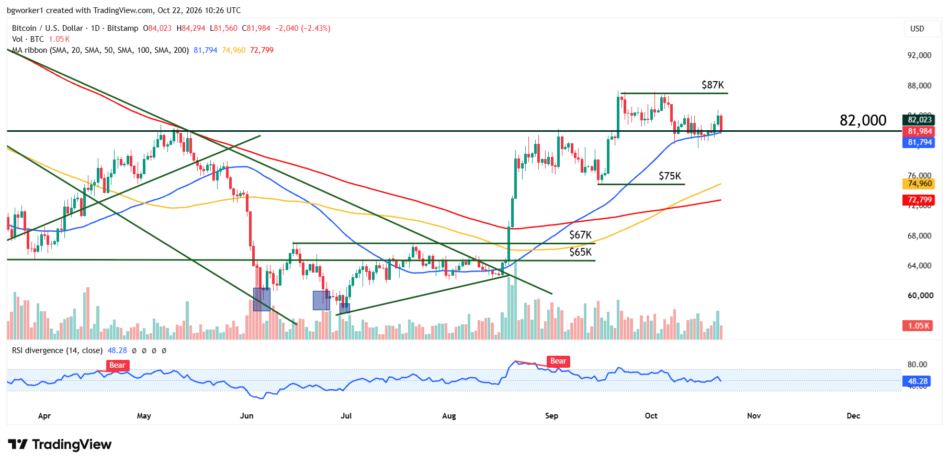
Bitcoin retreats after a rejection at $84,800, leaving the $82,000 support zone critical for the next move.