Hot CPI Sends Bitcoin Below $82K as Rate Hike Bets Rise
BTC breaks support at $82K as bullish divergence emerges on the 4-hour RSI.
Bitcoin declined sharply after the main gauge of inflation in the US increased more than analysts had expected, sending the odds of another rate hike higher. The original cryptocurrency dropped as low as $79,600 on Thursday, moving further away from the key threshold at $82,000, which acted as both resistance and support in the past.
The US Consumer Price Index (CPI) disappointed on all fronts, with the monthly Core CPI showing a 0.3% change, greater than the estimated 0.2%. The yearly Core CPI came in at 2.6%, higher than the previous 2.4% and higher than the expected 2.5%. The monthly headline CPI showed a change of 0.6%, above the previous 0.4% but in line with expectations. The yearly headline CPI jumped from 3.4% to 3.7%.
Soon after the CPI numbers were posted, the odds of a rate hike in October jumped to 30%. Just a week ago, the probability was around 17%, according to the CME FedWatch tool. The December odds currently sit at around 65%, according to the same source.
Spot Bitcoin ETF funds saw $261 million of outflows on Wednesday, reversing $175 million of inflows a day prior, according to Coinglass data. It looks like Bitcoin’s correlation with the US interest rate is growing, and this is showing in both the price and ETF activity.
The broader crypto market also experienced declines, but some of the major altcoins posted sharper drops compared to Bitcoin. While BTC is down 1.92% over the last 7 days, Ethereum is showing losses of 7.25%, and Ripple’s XRP is down 6.73%. The biggest losers in the top 10 are Solana (SOL) and Zcash (ZEC), both with losses that exceeded 10%.
Chart Analysis – BTC/USD
The bulls have lost the momentum that allowed them to take the price to $87,000 twice. Now it looks like the balance has shifted in favour of the bears, and if the current support zone breaks, the rally will be in serious danger.
The key level at $82,000 has been broken, but the entire zone between $75,000 and $82,000 is most likely filled with buy orders, which means that BTC can find support somewhere in that range. A recovery should break through $82,000 with conviction and volume to be considered a true direction change and not just noise.
The RSI is not oversold on the Daily chart, but on the 4-H chart, it already tapped into oversold territory, and now it is showing bullish divergence (the price is making a lower low, but the RSI is only printing a higher low). This is a bullish sign that turns into a bullish move more often than not. The first resistance is located at $82,000, followed by $84,000.
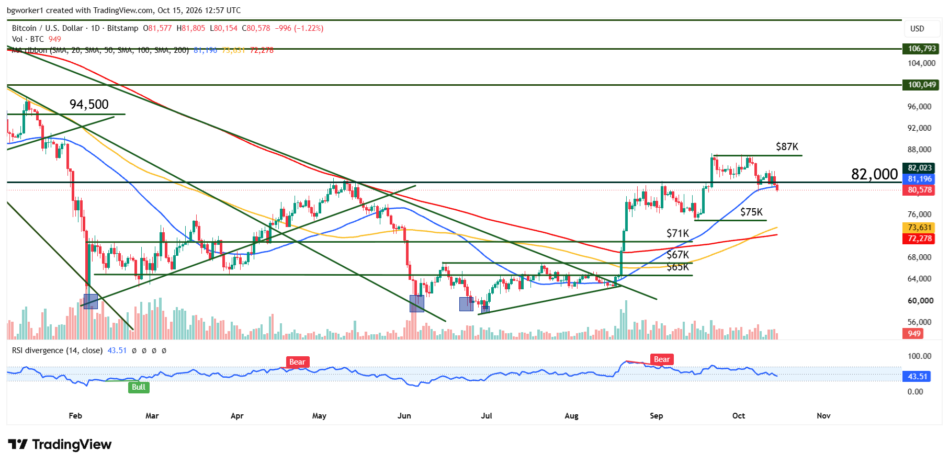
Bitcoin falls below $82K after hotter-than-expected US inflation, breaking through the 50-Day Moving Average and possibly heading into $75K