Bitcoin Smashes $82K as ETF Flows Power Breakout
BTC retreats from $87,300 but remains above the key $82K breakout level
Despite the Clarity Act Senate setback, Bitcoin broke through the key resistance at $82,000 and peaked above $87,300 before retreating into the $83,000 area. Soon after the failed Clarity vote, the Securities and Exchange Commission (SEC) announced new and favourable rules for tokenised-asset trading.
The Commodity Futures Trading Commission (CFTC) proposed a wider trading framework, which is not finalised yet, but it has been submitted to the White House for review. Together, the actions of the SEC and CFTC helped improve Bitcoin sentiment, fuelling the rally, but these were not the only catalysts.
Spot Bitcoin ETF inflows helped the bullish breakout, showing there is massive buying pressure behind it, not just a “good news” temporary boost. According to data from Coinglass, ETF inflows amassed more than $2.1 billion over the first three days of the week, with BlackRock’s IBIT and Fidelity’s FBTC funds making up more than 75% of the total. The pace slowed each day, but buying remained positive since Monday, September 21.
The ETF inflows provided the buying demand that contributed significantly to the breakout, while forced buying accelerated the move. As BTC broke above $80,000 and soon moved above $82,000, bearish positions were liquidated and automatically turned into buys. When a stop-loss or a margin call for a sell position is triggered, that position is closed via a buy order. Liquidated shorts turn into automatic buys, thus creating a snowball effect that pushes the price even higher.
More rate hikes ahead?
After the frenzy buying spree at the beginning of the week, Bitcoin cooled off and retreated towards the recently broken key level at $82,000. This was in part triggered by profit-taking, but also by hot United States PMI data that came out on Wednesday. The stronger economic growth renewed inflation pressure and pushed the odds of another rate hike in September to 75%, according to the CME FedWatch tool. This in turn puts pressure on Bitcoin and the broader crypto market.
Chart Analysis – BTC/USD
For the time being, the pullback into the $82K – $83K area can be considered normal price action, and shouldn’t be viewed as something worrying. The rally that began last week on Friday is a continuation of the move started in mid-August, and the break of $82K is a massive bullish development.
The RSI was recently overbought, which was an early signal that a pullback would come sooner rather than later. However, as long as the price stays above $82K support, the bias is bullish, but for a full trend reversal, we would need to see the 100-day MA (yellow line) move cross above the 200-day MA (red line).
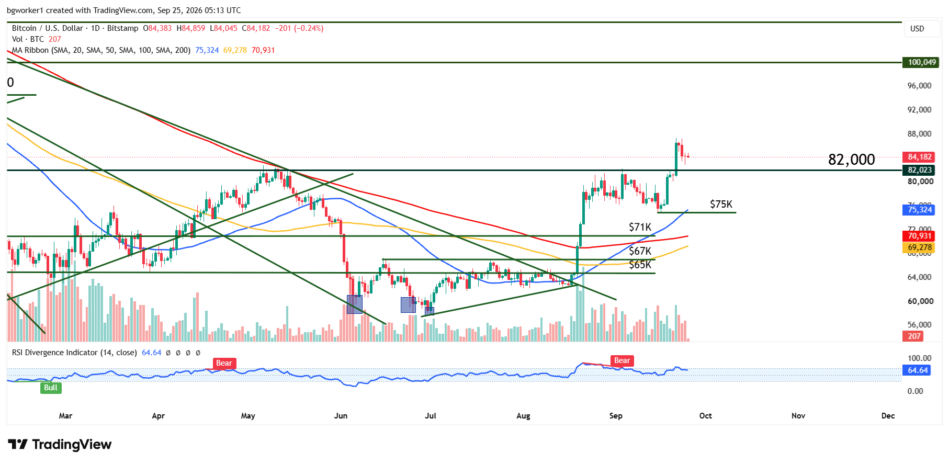
Bitcoin pulls back toward $82,000 after breaking above key resistance and reaching $87,300, with the former resistance level now acting as key support.