Bitcoin Bulls Face $82K Hurdle as ETF Inflows Surge
BTC struggles below $82K as overbought RSI raises the odds of a correction.
After the massive rally started on August 17, Bitcoin pierced the $80K level several times, but the bulls failed to break the level decisively. It looks like the initial surge is taking a breather, and maybe it’s time for a pullback if the price cannot stabilize above $80K – $82K.
Spot Bitcoin Exchange-Traded Funds (ETFs) have seen a massive influx of capital, with 8 consecutive days of inflows. The overall inflow value during this period exceeded $2.8 billion, according to data from Coinglass.
Increased ETF inflows are always a good sign, and the latest Bitcoin rally coincided with increased ETF activity. The bullish move started on August 17, when Bitcoin ETFs registered $297 million worth of inflows. That was huge, considering that a day prior, BTC ETFs saw $56 million in outflows. The biggest inflows coincided with the biggest Daily candles from the current move: on August 19, ETFs added $517 million, and on August 20, they added more than $606 million.
The Jackson Hole Symposium will continue today, and it will be particularly interesting to see what Fed Chair Warsh will talk about during his speech, scheduled at 2:00 pm GMT. The Fed’s preferred inflation gauge, the PCE Price Index, showed on Wednesday that some upside risks still remain, but the pace is not alarming, which means the interest rate can remain at current levels for longer.
This would benefit risk-on assets such as cryptocurrencies, but if Warsh adopts a hawkish stance (indicating higher rates), it could deflate the optimism of the Bitcoin bulls.
Chart Analysis – BTC/USD
Bitcoin is clearly at a crossroads, with $82K as the main level to watch. This resistance could be the decisive factor for a trend reversal but could also trigger another strong dip.
Earlier in the year, the price broke a long-term bearish trend line, but then it encountered the resistance at $82K and dropped sharply to around $58K. Now all that drop has been erased, and the price is approaching the same resistance again.
On a Daily chart, the price sits above all three moving averages (50-day MA, 100-day MA, and 200-day MA) but the Relative Strength Index (RSI) is very high, with a value of 81, which is way above what is considered overbought (70).
The overbought RSI combined with the strength of the $82K resistance could trigger a pullback. However, on a Weekly chart, the RSI is nowhere near overbought, so after a potential pullback, the rally could continue.
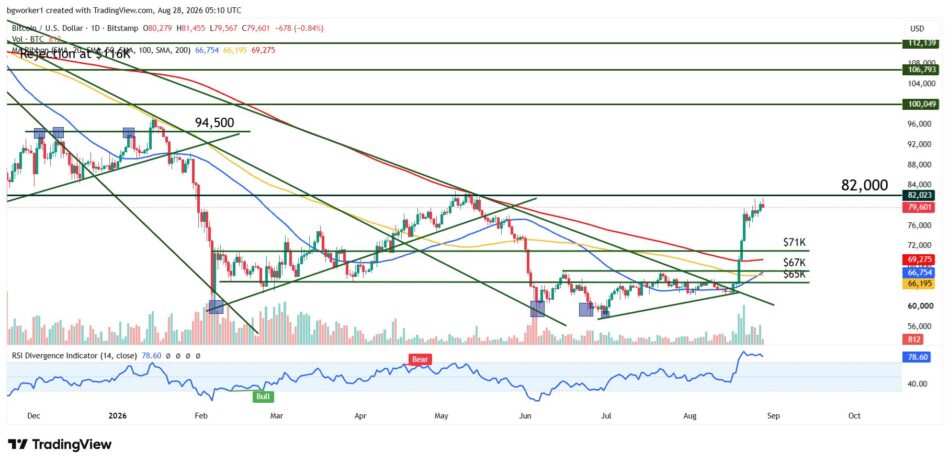
Bitcoin approaches the key $82,000 resistance level after a powerful rally, while an RSI of 81 raises the risk of a pullback despite the massive bullish move.