Bitcoin Slips Despite Cooler Inflation and Lower Fed Bets
BTC tests trend-line support near the 50 MA, risks falling to $58K
Bitcoin slipped to the $63K level after the US Consumer Price Index (CPI) matched analysts’ expectations on Wednesday. The fact that inflation is not swelling should be a tailwind for Bitcoin and other cryptocurrencies because the Fed is likely to postpone a rate hike.
The last Non-Farm Payrolls (NFP) report missed expectations by a huge margin, and inflation is not alarming. This should deter the Fed from hiking, which is actually reflected by the CME FedWatch tool, which showed that the odds of a rate hike in September have dropped to 36% from 46% before the CPI release. A week ago, before the disappointing NFP report, the odds were 67%.
That’s quite a big drop in a short while, but Bitcoin doesn’t seem to react positively. The lack of response could be attributed to the lack of a surprise factor. All versions of the CPI came in line with expectations, which was probably enough to calm nerves but not enough to spark a rally.
Spot Bitcoin ETF activity is slowing down, with dwindling inflows and outflows. According to data from Coinglass, this week Bitcoin ETFs posted two days with $7.80 million inflows and $61 million outflows, while Ethereum ETFs totaled $1.70 million outflows and $7.40 million inflows on Tuesday and Wednesday, respectively. In the meantime, XRP ETFs posted 4 consecutive days with ZERO inflows/outflows.
There’s still no end in sight for the war between the US and Iran, with both countries accusing each other of violating the terms of their prior agreements or failing to deliver on promises. Progress on the Clarity Act is stalling, and the first possible news about it can only come in September after the summer recess of the lawmakers. With all this in mind, we can safely say that the overall picture is not favorable for risk-on assets such as cryptocurrencies.
Chart Analysis – BTC/USD
Bitcoin bulls have failed once again to break the resistance at $65K, and the price has fallen close to the 50-day Moving Average (blue line). The bullish line drawn from the June low is being tested as we speak, and a break is very possible. In case of a break, there is a minor support around $62K, but if that fails, the next destination could be the previous low at $58K.
The RSI is neutral, and all three moving averages are stacked in a bearish formation, indicating a downtrend. There’s a high probability that we will see more downside, but a break above $65K could bring in some buyers. However, for that to happen, Bitcoin needs a catalyst from the macroeconomic or geopolitical side.
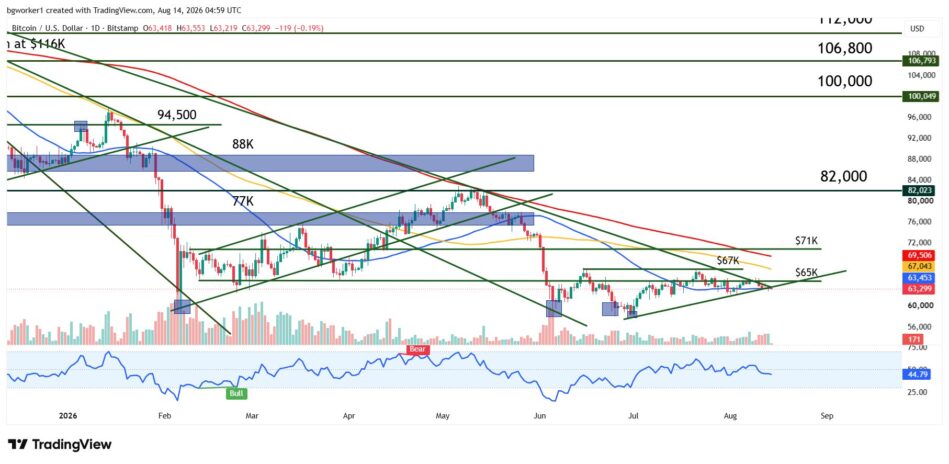
Bitcoin falls back toward the 50-day moving average as the bullish trend line from the June low comes under pressure after another rejection at $65,000.