Clarity Act Delay Caps Bitcoin Recovery Despite ETF Inflows
Bitcoin remains below a long-term bearish trend line, while $65K continues to cap upside momentum.
Bitcoin spot exchange-traded funds (ETFs) kicked off the month of August with a 3-day streak of inflows, totaling over $625 million, according to data from Coinglass. We are seeing a modest Bitcoin rally, but major resistance is still overhead, and the price is trading very close to a major bearish trend line drawn from the 2025 All-Time High (ATH) at $126K.
ETF inflows are a positive development that shows increased institutional activity, but without a stronger catalyst, Bitcoin is not likely to jump substantially. Such a catalyst would be the passing of the Clarity Act bill, but with the August recess around the corner, the probability is very low.
After the recess, the midterm elections are up, which means the Clarity Act will likely be pushed back even more. At the time of writing, the probability of the Clarity Act becoming law in 2026 is just 16%, according to Polymarket data.
The Middle East conflict also weighs on the crypto market, but we’ve got another hint from President Trump that a deal is near. However, considering how many times they got close to a deal only to have it crumble the next day, I think it’s better to be cautiously optimistic at best.
Chart Analysis – BTC/USD
Bitcoin is struggling again at $65K, but this time it’s very close to the main trend line drawn from the ATH reached in October 2025, at $126,200. The break of this long-term trend line could ignite some bullishness and a fresh wave of buy orders.
The trend line and the horizontal resistance at $65K create a confluence zone, which is a stronger form of resistance. Typically, when confluence zones are broken, the price tends to continue in the direction of the break. Stop Loss orders are usually placed behind strong confluence zones, which means that if the price moves above the zone, all orders are triggered and they automatically turn into Buy orders.
In case of a break of $65K and the trend line, Bitcoin bulls will face another hurdle at $67K, where we already have a double top, yet another strong form of resistance. The 50-day Moving Average (blue line) is below the price, providing support, but the 100-day and 200-day Moving Averages are above the price, showing that Bitcoin is still in a downtrend.
Currently, there’s a lack of volatility – the RSI is trading in the middle of its range, without clear direction, and the 50-day MA is flat – which means that we need some positive fundamental developments if we’re going to see a substantial rally.
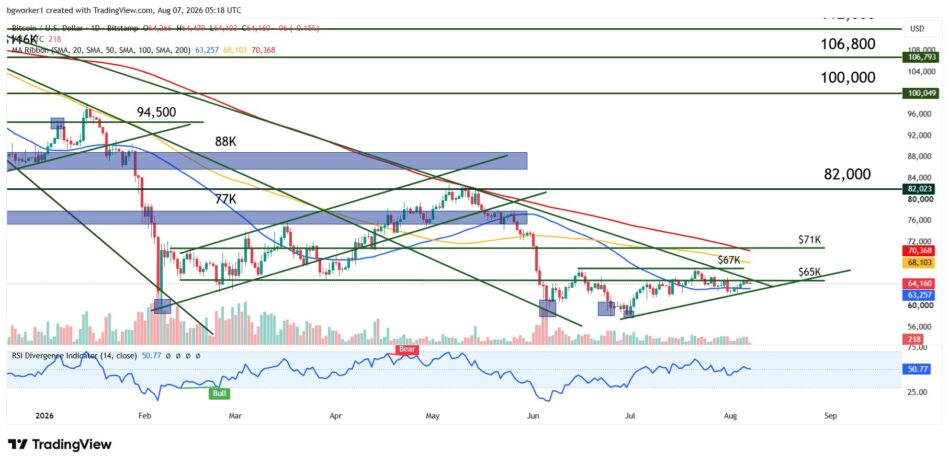
Bitcoin tests a major confluence resistance where the $65,000 horizontal level intersects with a long-term bearish trend line drawn from the 2025 ATH